
Question 1
Mark as Complete
Mark Scheme
Question 2

The scatterplot shows the relationship between two variables, `x` and `y`, for data set `E`. A line of best fit is shown. Data set `F` is created by multiplying the `y`-coordinate of each data point from data set `E` by `3.9`. Which of the following could be an equation of a line of best fit for data set `F`?
A) `y = 46.8 + 5.9x`
B) `y = 46.8 + 1.5x`
C)`y = 12 + 5.9x`
D) `y = 12 + 1.5x`
Mark as Complete
Mark Scheme
Question 1
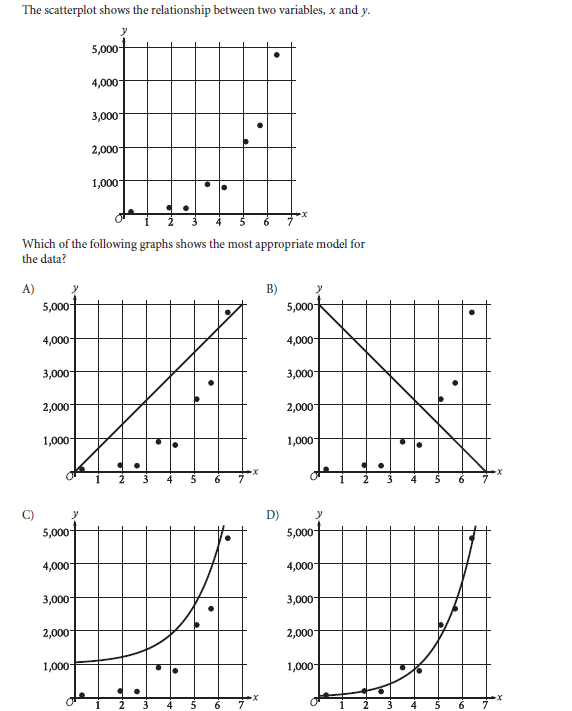
Answer: D
The data points on the scatterplot show a trend that is both increasing and curved. An appropriate model should be a curve that follows this trend, with data points appearing both above and below the line. The model in option D is the only one that is an increasing curve and fits the data points appropriately.
Question 2
The scatterplot shows the relationship between two variables, `x` and `y`, for data set `E`. A line of best fit is shown. Data set `F` is created by multiplying the `y`-coordinate of each data point from data set `E` by `3.9`. Which of the following could be an equation of a line of best fit for data set `F`?
A) `y = 46.8 + 5.9x`
B) `y = 46.8 + 1.5x`
C)`y = 12 + 5.9x`
D) `y = 12 + 1.5x`
Answer: A
When every `y`-coordinate in a data set is multiplied by a constant (`3.9` in this case), the `y`-intercept and the slope of the line of best fit are also multiplied by that same constant.
`y`-intercept: The original line for data set `E` has a `y`-intercept of approximately `12`. The new y-intercept for data set `F` will be `12 xx 3.9 = 46.8`.
Slope: The original line for data set `E` passes through approximately `(0, 12)` and `(12, 30)`. Its slope is `(30-12)/(12-0) = 18/12 = 1.5`. The new slope for data set `F` will be `1.5 xx 3.9 ≈ 5.85`, which is close to `5.9`. Therefore, the equation for the line of best fit for data set `F` is approximately `y = 46.8 + 5.9x`.
Question 1
Question 2
The scatterplot shows the relationship between two variables, `x` and `y`, for data set `E`. A line of best fit is shown. Data set `F` is created by multiplying the `y`-coordinate of each data point from data set `E` by `3.9`. Which of the following could be an equation of a line of best fit for data set `F`?
A) `y = 46.8 + 5.9x`
B) `y = 46.8 + 1.5x`
C)`y = 12 + 5.9x`
D) `y = 12 + 1.5x`

