
Question 1
`4, 4, 4, 4, 8, 8, 8, 13, 13`
Which frequency table correctly represents the data listed?
A)
| Number | Frequency |
| `4` | `4` |
| `8` | `3` |
| `13` | `2` |
B)
| Number | Frequency |
| `4` | `4` |
| `3` | `8` |
| `2` | `13` |
C)
| Number | Frequency |
| `4` | `16` |
| `8` | `24` |
| `13` | `26` |
D)
| Number | Frequency |
| `16` | `4` |
| `24` | `8` |
| `26` | `13` |
Mark as Complete
Mark Scheme
Question 2
`71, 72, 73, 76, 77, 79, 83, 87, 93`
What is the median of the data shown?
A) `71`
B) `77`
C) `78`
D) `79`
Mark as Complete
Mark Scheme
Question 3
`4, 10, 18, 4, 4, 5, 6, 5`
What is the median of the data set shown?
A) `4`
B) `5`
C) `7`
D) `14`
Mark as Complete
Mark Scheme
Question 4
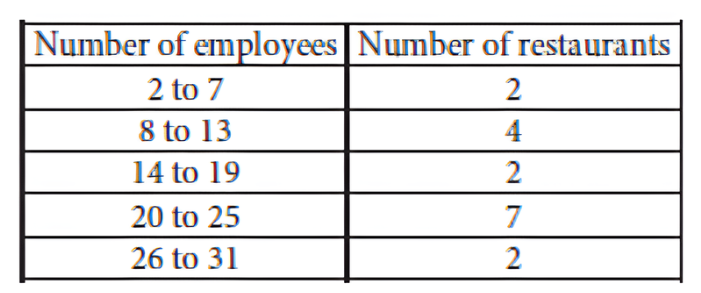
The table shown summarizes the number of employees at each of the `17` restaurants in a town. Which of the following could be the median number of employees for the restaurants in this town?
A) `2`
B) `9`
C) `15`
D) `21`
Mark as Complete
Mark Scheme
Question 1
`4, 4, 4, 4, 8, 8, 8, 13, 13`
Which frequency table correctly represents the data listed?
A)
| Number | Frequency |
| `4` | `4` |
| `8` | `3` |
| `13` | `2` |
B)
| Number | Frequency |
| `4` | `4` |
| `3` | `8` |
| `2` | `13` |
C)
| Number | Frequency |
| `4` | `16` |
| `8` | `24` |
| `13` | `26` |
D)
| Number | Frequency |
| `16` | `4` |
| `24` | `8` |
| `26` | `13` |
Answer: A
A frequency table is a table that lists the data value and shows the number of times the data value occurs. In the data listed, the number `8` occurs four times, the number `8` occurs three times, and the number `13` occurs two times. This corresponds to the table in Choice A.
Question 2
`71, 72, 73, 76, 77, 79, 83, 87, 93`
What is the median of the data shown?
A) `71`
B) `77`
C) `78`
D) `79`
Answer: B
To find the median, first we list the data values in ascending order: `71, 72, 73, 76, 77, 79, 83, 87, 93`. (The data shown is already in ascending order). The median of a data set with an odd number of data values is defined as the middle value of the ordered list of values. The data set shown has nine values, so the median is the fifth value in the ordered list, which is `77`.
Question 3
`4, 10, 18, 4, 4, 5, 6, 5`
What is the median of the data set shown?
A) `4`
B) `5`
C) `7`
D) `14`
Answer: B
To find the median, first list the data values in ascending order: `4, 4, 4, 5, 5, 6, 10, 18`.
Since there is an even number of values `(8)`, the median is the average of the two middle values. The two middle values are the `4^(th)` and `5^(th)` values, which are both `5`. The median is therefore `5`.
Question 4
The table shown summarizes the number of employees at each of the `17` restaurants in a town. Which of the following could be the median number of employees for the restaurants in this town?
A) `2`
B) `9`
C) `15`
D) `21`
Answer: D
With `17` restaurants, the median value will be the value for the `9^(th)` restaurant when they are ordered from fewest to most employees.
Restaurants `1`-`2` are in the "`2` to `7`" range.
Restaurants `3`-`6` are in the "`8` to `13`" range.
Restaurants `7`-`8` are in the "`14` to `19`" range.
Restaurants `9`-`15` are in the "`20` to `25`" range. Since the `9^(th)` restaurant falls into the "`20` to `25`" range, the median number of employees must be within this range. Of the choices, only `21` is in this range.
Question 1
`4, 4, 4, 4, 8, 8, 8, 13, 13`
Which frequency table correctly represents the data listed?
A)
| Number | Frequency |
| `4` | `4` |
| `8` | `3` |
| `13` | `2` |
B)
| Number | Frequency |
| `4` | `4` |
| `3` | `8` |
| `2` | `13` |
C)
| Number | Frequency |
| `4` | `16` |
| `8` | `24` |
| `13` | `26` |
D)
| Number | Frequency |
| `16` | `4` |
| `24` | `8` |
| `26` | `13` |
Question 2
`71, 72, 73, 76, 77, 79, 83, 87, 93`
What is the median of the data shown?
A) `71`
B) `77`
C) `78`
D) `79`
Question 3
`4, 10, 18, 4, 4, 5, 6, 5`
What is the median of the data set shown?
A) `4`
B) `5`
C) `7`
D) `14`
Question 4
The table shown summarizes the number of employees at each of the `17` restaurants in a town. Which of the following could be the median number of employees for the restaurants in this town?
A) `2`
B) `9`
C) `15`
D) `21`

