
Question 1
`(p + 3) + 8 = 10`
What value of `p` is the solution to the given equation?
A) `-1`
B) `5`
C) `15`
D) `21`
Mark as Complete
Mark Scheme
Question 2
`x + 40 = 95`
What value of `x` is the solution to the given equation?
Mark as Complete
Mark Scheme
Question 3
Which expression is equivalent to `20w - (4w + 3w)`?
A) `10w`
B) `13w`
C) `19w`
D) `21w`
Mark as Complete
Mark Scheme
Question 4
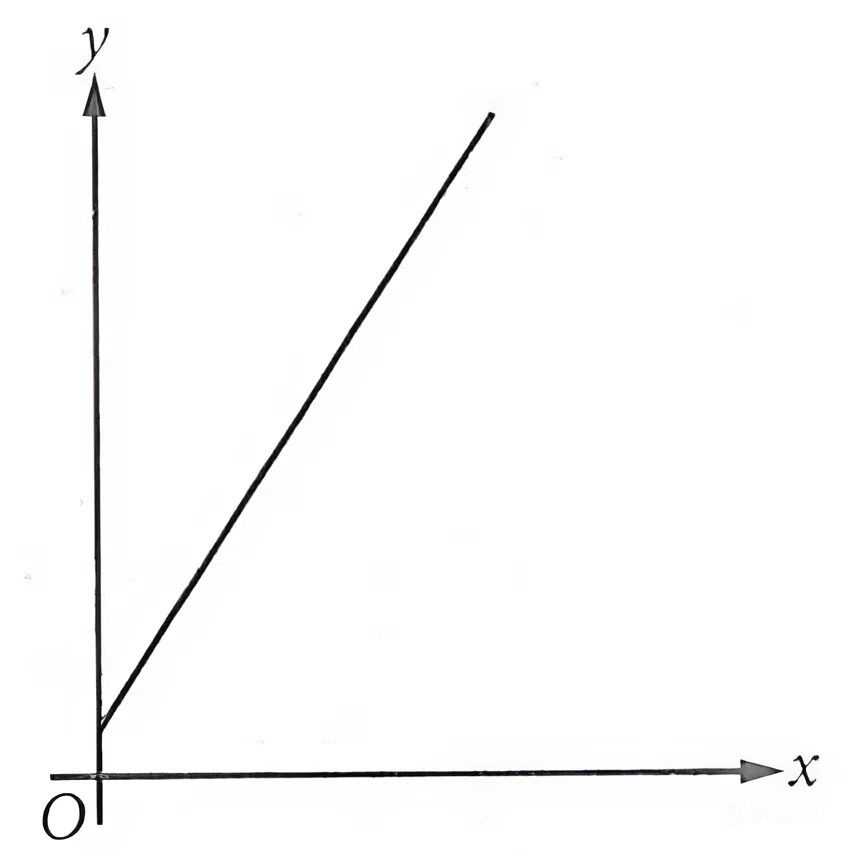 The graph represents the total charge, in dollars, by an electrician for `x` hours of work. The electrician charges a onetime fee plus an hourly rate. What is the best interpretation of the slope of the graph?
A) The electrician’s hourly rate
B) The electrician’s onetime fee
C) The maximum amount that the electrician charges
D) The total amount that the electrician charges
Mark as Complete
Mark Scheme
Question 5
If `6 + x = 9`, what is the value of `18 + 3x`?
Mark as Complete
Mark Scheme
Question 6
`7(2x − 3) = 63`
Which equation has the same solution as the given equation?
A) `2x − 3 = 9`
B) `2x − 3 = 56`
C) `2x − 21 = 63`
D) `2x − 21 = 70`
Mark as Complete
Mark Scheme
Question 1
`(p + 3) + 8 = 10`
What value of `p` is the solution to the given equation?
A) `-1`
B) `5`
C) `15`
D) `21`
Answer: A
To solve for `p`, you first simplify the equation. Subtract `8` from both sides of the equation `(p + 3) + 8 = 10` to get `p + 3 = 2`. Then, subtract `3` from both sides to find that `p = -1`.
Question 2
`x + 40 = 95`
What value of `x` is the solution to the given equation?
Answer: `55`
Subtracting `40` from both sides of the given equation yields `x = 55`. Therefore, the value of `x` is `55`.
Question 3
Which expression is equivalent to `20w - (4w + 3w)`?
A) `10w`
B) `13w`
C) `19w`
D) `21w`
Answer: B
Combining like terms inside the parentheses of the given expression yields `20w - (7w)`. Combining like terms in this resulting expression yields `13w`.
Question 4
The graph represents the total charge, in dollars, by an electrician for `x` hours of work. The electrician charges a onetime fee plus an hourly rate. What is the best interpretation of the slope of the graph?
A) The electrician’s hourly rate
B) The electrician’s onetime fee
C) The maximum amount that the electrician charges
D) The total amount that the electrician charges
Answer: A
It is given that the electrician charges a onetime fee plus an hourly rate. It’s also given that the graph represents the total charge, in dollars, for `x` hours of work. This graph shows a linear relationship in the xy-plane. Thus, the total charge `y`, in dollars, for `x` hours of work can be represented as `y = mx + b`, where `m` is the slope and `(0, b)` is the y-intercept of the graph of the equation in the xy-plane. Since the given graph represents the total charge, in dollars, by an electrician for `x` hours of work, it follows that its slope is `m`, or the electrician’s hourly rate. Note that Choice B is incorrect because the electrician’s onetime fee is represented by the y-coordinate of the y-intercept, not the slope, of the graph.
Question 5
If `6 + x = 9`, what is the value of `18 + 3x`?
Answer: `27`
Multiplying both sides of the given equation by `3` yields `3(6 + x) = 3(9)`, or `18 + 3x = 27`. Therefore, the value of `18 + 3x` is `27`.
Question 6
`7(2x − 3) = 63`
Which equation has the same solution as the given equation?
A) `2x − 3 = 9`
B) `2x − 3 = 56`
C) `2x − 21 = 63`
D) `2x − 21 = 70`
Answer: A
To find an equivalent equation, you can simplify the given equation. Dividing both sides of `7(2x − 3) = 63` by 7 yields `2x − 3 = 9`. This new equation will have the same solution.
Question 1
`(p + 3) + 8 = 10`
What value of `p` is the solution to the given equation?
A) `-1`
B) `5`
C) `15`
D) `21`
Question 2
`x + 40 = 95`
What value of `x` is the solution to the given equation?
Question 3
Which expression is equivalent to `20w - (4w + 3w)`?
A) `10w`
B) `13w`
C) `19w`
D) `21w`
Question 4
The graph represents the total charge, in dollars, by an electrician for `x` hours of work. The electrician charges a onetime fee plus an hourly rate. What is the best interpretation of the slope of the graph?
A) The electrician’s hourly rate
B) The electrician’s onetime fee
C) The maximum amount that the electrician charges
D) The total amount that the electrician charges
Question 5
If `6 + x = 9`, what is the value of `18 + 3x`?
Question 6
`7(2x − 3) = 63`
Which equation has the same solution as the given equation?
A) `2x − 3 = 9`
B) `2x − 3 = 56`
C) `2x − 21 = 63`
D) `2x − 21 = 70`

