
Question 1
A student carried out tests on the same volume of four different solutions to investigate the presence of protein, starch and reducing sugar in each.
The results are shown in the table.
| solution | Benedict’s solution | biuret reagent | iodine solution |
| 1 | brick-red | purple | yellow |
| 2 | blue | pale blue | blue-black |
| 3 | green | pale purple | yellow |
| 4 | orange | purple | yellow |
Which conclusion can be drawn from these results?
A. Solution 1 contains a high concentration of reducing sugar and protein but no starch.
B. Solution 2 contains starch and reducing sugar but no protein.
C. Solution 3 contains a moderate amount of starch and protein.
D. Solution 4 contains starch and the least reducing sugar.
Easy
Mark as Complete
Mark Scheme
Question 2
Which concentrations could be produced by a serial dilution of an `8.00%` glucose solution?
A. `4.00%, 2.00%, 1.00%, 0.50%` and `0.25%`
B. `4.00%, 3.00%, 2.00%, 1.00%` and `0.00%`
C.`6.00%, 4.00%, 2.00%, 1.00%` and `0.50%`
D. `8.00%, 6.00%, 4.00%, 2.00%` and `0.00%`
Easy
Mark as Complete
Mark Scheme
Question 3
An investigation was carried out into the effect of different treatments on the permeability of the cell surface membranes and tonoplasts of beetroot cells. Beetroot cell vacuoles contain a red pigment. This pigment is unable to pass out of the cells because it cannot diffuse through the tonoplasts or cell surface membranes.
`1 cm^3` cubes were cut from beetroot tissue and washed in running water for `20` minutes to remove any pigment released from damaged cells.
The cubes were then placed in test-tubes with different contents and observed for five minutes.
Which row shows a correct explanation for the observation recorded for one of the treatments?
| treatment | observation | explanation | |
| A. | dilute hydrochloric acid | contents of test-tube stay clear | membrane proteins have been denatured |
| B. | ethanol | contents of test-tube turn red | lipids, including membrane phospholipids, have dissolved |
| C. | water at 20 °C | contents of test-tube stay clear | membrane proteins have been denatured |
| D. | water at 80 °C | contents of test-tube turn red | lipids, including membrane phospholipids, have dissolved |
Medium
Mark as Complete
Mark Scheme
Question 4
Place the following statements about making up `100 cm^3` of a`5%` sucrose solution in the correct order:
1. Make up to `100 cm^3` by adding distilled water.
2. Dissolve in a small amount of distilled water.
3. Place dissolved sucrose into a `100 cm^3` volumetric flask.
4. Use a top pan balance to measure out `5` g of sucrose.
A. 1 2 3 4
B. 3 1 4 2
C. 4 2 3 1
D. 2 4 1 3
Easy
Mark as Complete
Mark Scheme
Question 5
To decide what concentration of reducing sugar is in a particular solution, we must produce a calibration curve graph using a range of known concentrations. These are created by diluting stocks of reducing sugar solutions of known concentrations.
a. Copy and complete the Table 1 to show how to make a range of concentrations when given a 1% standard solution of sucrose. The first two are done for you.
| Concentration of sucrose / % | Volume of 1% glucose solution / `cm^3` | Volume of added water / cm3 |
| 0.9 | 9 | 1 |
| 0.8 | 8 | 2 |
| 0.7 | ||
| 0.6 | ||
| 0.5 | ||
| 0.4 | ||
| 0.3 | ||
| 0.2 | ||
| 0.1 |
Table 1. How to make a range of concentrations when given a 1% standard solution of sucrose.
To make wider ranges of dilutions you will need to be able to perform serial dilutions. An example of this is shown in the right-hand diagram below.
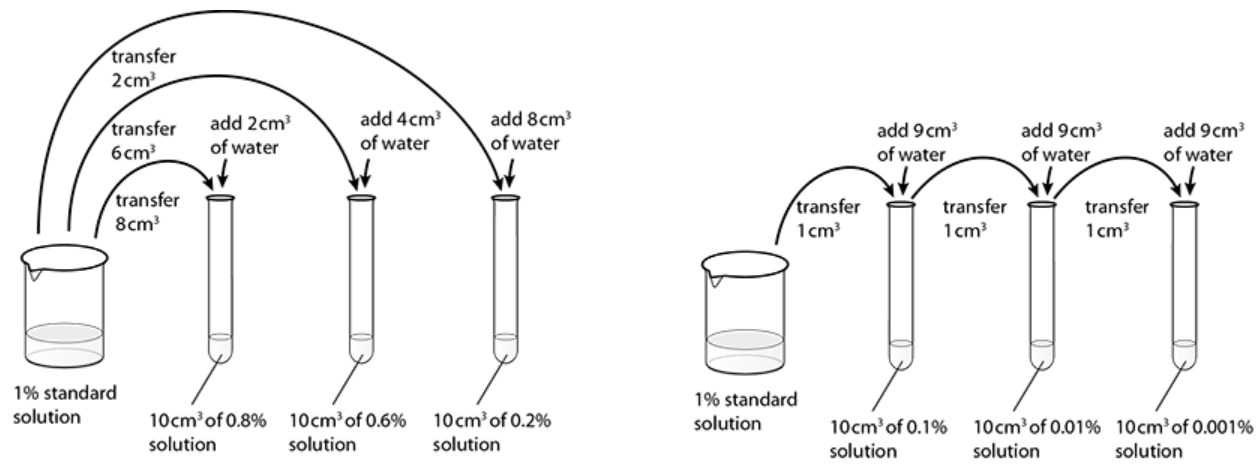
Figure 1. Producing a range of concentrations from standard solutions.
b. Describe how you could make up the following glucose concentrations when given a 1% standard solution (there may be several different ways for each):
i. `0.02%`
ii. `0.003%`
iii. `0.0005%`
Easy
Mark as Complete
Mark Scheme
Question 6
A calibration curve is a graph with the known concentrations plotted against their percentage absorbance. The table below shows the percentage of red light absorbed using a colorimeter from Benedict's tests performed on a variety of glucose concentrations.
| Concentration of glucose / % | Absorption of light / % |
| 1.0 | 5 |
| 0.8 | 35 |
| 0.6 | 45 |
| 0.4 | 54 |
| 0.2 | 85 |
| 0.1 | 92 |
| 0.0 | 96 |
A calibration curve of the concentration of glucose against the absorption of light is plotted below.
When comparing different solutions of glucose using this method, it is important to control many factors in order to make a valid comparison.
List three factors that need to be kept constant.
Medium
Mark as Complete
Mark Scheme
Question 7
Like lactose, sucrose is a disaccharide. If you were given a solution of lactose and a solution of sucrose, state briefly how you could distinguish between them.
Medium
Mark as Complete
Mark Scheme
Question 8
When Benedict’s solution is added to a sucrose solution and put into a boiling water-bath, no change in colour is observed.
a. State why no colour change is observed.
b. Describe briefly how to test for the presence of sucrose.
Medium
Mark as Complete
Mark Scheme
Question 9
Part 1: Preparing the different concentrations of glucose by serial dilution
It is important to be able to understand how to make different concentrations of solution by using the technique of serial
dilution (Figure 1 shows the beginning of this process).
1. Label the test tubes `1-7`.
2. Using a pipette, place `10 cm^³` `10%` glucose solution into tube 1.
3. Remove 1`cm^³` of this solution from tube 1 and place into tube 2.
4. Add 9 `cm^³` distilled water to tube 2 and mix. This is now diluted to `1%` glucose.
5. Remove 1 `cm^³` of the `1%` glucose solution from tube 2 and place into tube 3.
6. Add 9 `cm^³` distilled water into tube 3 and mix. This is now diluted to `0.1%` glucose.
7. Remove 1 `cm^³` of `0.1%` glucose from tube 3 and place into tube 4.
8. Add 9 `cm^³` distilled water to tube 4 and mix. This is now diluted to `0.01%` glucose.
9. Remove 1 `cm^³`of`0.01%` glucose from tube 4 and place into tube 5.
10. Add 9 `cm^³` distilled water to tube 5 and mix. This is now diluted to `0.001%` glucose.
11. Remove 1 `cm^³` of `0.001%` glucose from tube 5 and place into tube 6.
12. Place 9 `cm^3` distilled water into tube 6.
13. Remove 1 `cm^3` of `0.001%` glucose from tube 6 and throw it away.
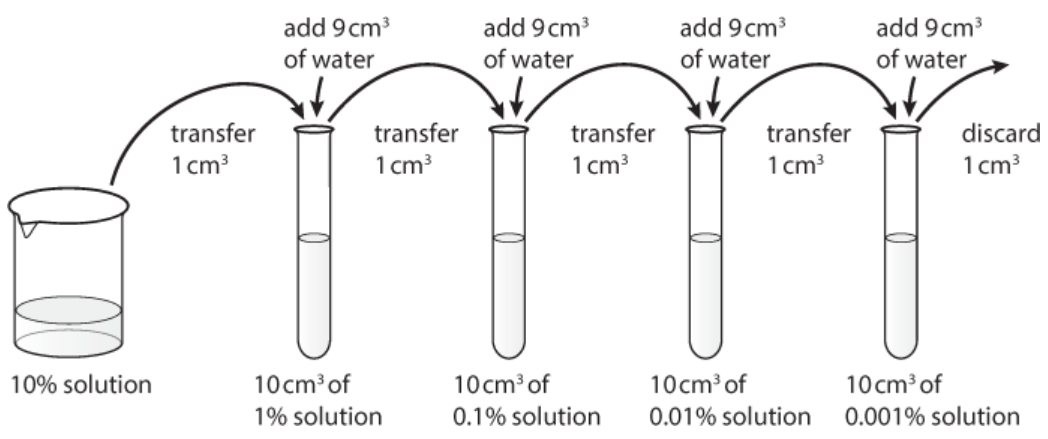
Figure 1. Method for serial dilution.
• Part 2: Carrying out the Benedict's test
1. Set up a boiling water bath.
2. Place 9 `cm³` unknown glucose solution into tube 7.
3. Add 5 `cm³` Benedict's solution to each of tubes 1-6.
4. Carefully place tubes 1-6 into the boiling water bath for exactly 5 min.
5. Turn off the Bunsen burner and using a test tube holder, carefully remove the test tubes and place them in a rack in order 1-6.
6. Record the colours of the test tube, or colouring the test tubes in Figure 2 in the Results section below the appropriate colours.
7. Compare the colour of the 'unknown' solution with the colours of the known standards. Identify the concentration of the standards which have the most similar colour. If the colour is not exactly the same as the standard, look at the colours of the solutions with higher and lower concentrations. This can help you to suggest a range within which the concentration lies.
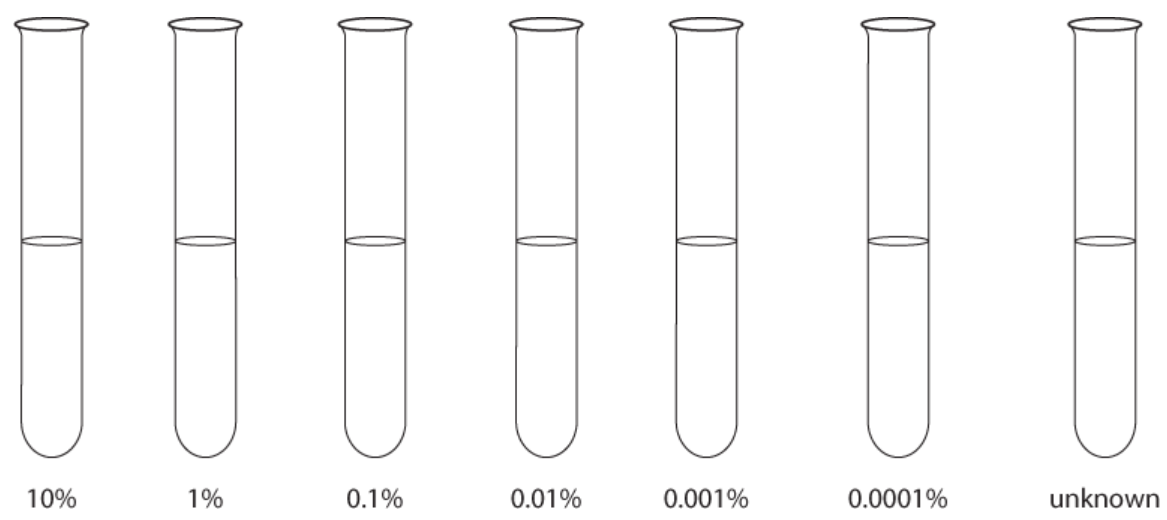
Figure 2. Experimental results from the investigation.
a. Explain why this test is considered a semi-quantitative test rather than a quantitative one.
b. How certain can we be about the exact concentration of glucose in the unknown solution?
c. Why was 1 `cm^3` thrown away from the last dilution?
d. Several variables were kept constant for all the tubes. List as many of these standardised variables as possible and explain why it is essential to keep them constant.
e. It is important that the amount of Benedict's solution added is greater than the glucose. Explain how it could affect the result if there were too little Benedict's solution.
f. Explain the purpose of tube 6.
g. Suggest an alternative method that could be used to make the test fully quantitative.
h. Serial dilution can be used to make many different concentration ranges. This experiment used a dilution factor of 10 each time. Calculate the concentrations of glucose solutions that would have been produced if 5 `cm^3` of water and 5 `cm^3` glucose solution were used each time instead of 9 `cm^3` water and 1 `cm^3` glucose solution.
Hard
Mark as Complete
Mark Scheme
Question 10
Part 1: Making the standard concentrations of starch
1. Use the same method to make serial dilutions of glucose to make 9 cm3 of each of the following concentrations of starch suspensions starting with a 1% stock:
• 1%
• 0.1%
• 0.01%
• 0.001%
• 0.0001%
Label each of the five test tubes appropriately.
2. Place 9 `cm^3` distilled water into a sixth test tube.
3. Add three drops of iodine solution to each tube and mix.
4. Put all the test tubes into a rack in order of decreasing starch concentration.
5. Either colour each tube the appropriate colour in Figure 2 in the Results section or record the colours of the test tube.
Part 2: Making the banana extracts
1. Label three test tubes, A, B and C.
2. Use a knife to cut out a 1 `cm^3` piece of green, unripe banana (without the peel) and place it into a beaker (see Figure 1).
3. Add 10 `cm^3` distilled water to the beaker and mash the banana with a spatula to make a suspension of banana. Transfer the extract to tube A.
4. Repeat the procedure for the yellow (ripe) and black (over-ripe) bananas, transferring the extracts into tubes B and C respectively.
5. Place all three test tubes into a boiling water bath for 5 min.
6. Remove the tubes from the water bath and leave to cool for 10 min.
7. Add five drops of iodine to each solution, mix and compare each with the standard dilutions.
8. Record the approximate concentrations of starch in each type of banana in the Results section.
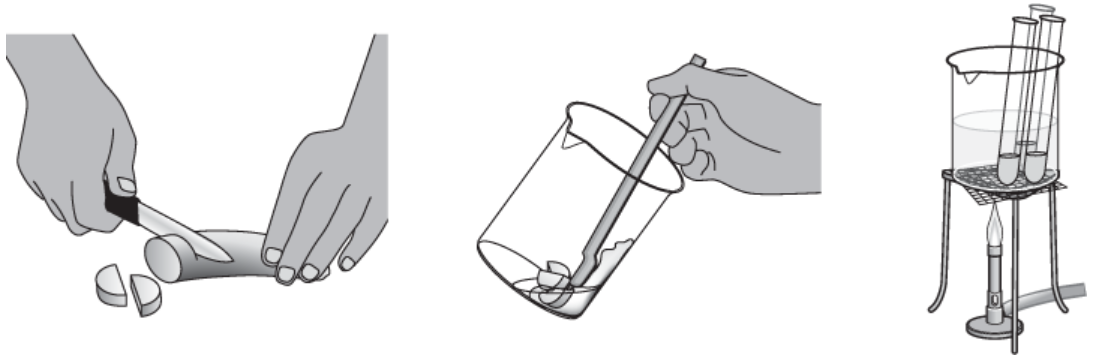
Figure 1. Method for part 2 of investigation.
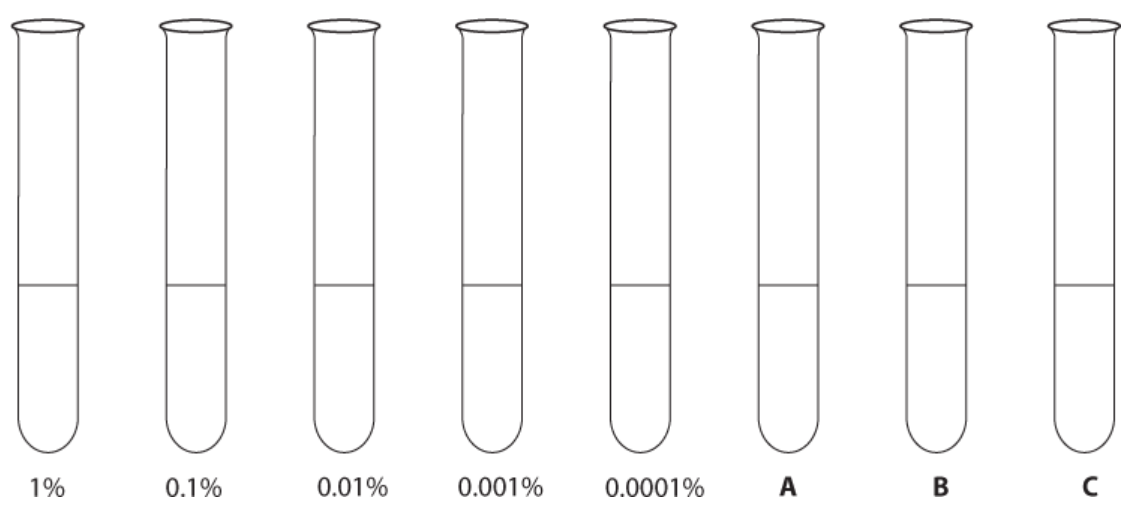
Figure 2. Experimental results for investigation.
a. The approximate starch ranges (the concentrations of the standards within which the colour lies) for each banana are:
• green (unripe): range: …………. to …………………..
• yellow (ripe): range: …………. to …………………..
• black (over-ripe): range: …………. to ………………
b. Explain what the investigation shows you about what happens to bananas as they ripen.
c. Discuss the accuracy of this method and suggest how it could be improved to give more precise values of starch concentrations.
d. Describe four limitations of this investigation. These should not simply be errors but things that mean that the results may not be accurate or the conclusion valid.
Hard
Mark as Complete
Mark Scheme
Question 1
A student carried out tests on the same volume of four different solutions to investigate the presence of protein, starch and reducing sugar in each.
The results are shown in the table.
| solution | Benedict’s solution | biuret reagent | iodine solution |
| 1 | brick-red | purple | yellow |
| 2 | blue | pale blue | blue-black |
| 3 | green | pale purple | yellow |
| 4 | orange | purple | yellow |
Which conclusion can be drawn from these results?
A. Solution 1 contains a high concentration of reducing sugar and protein but no starch.
B. Solution 2 contains starch and reducing sugar but no protein.
C. Solution 3 contains a moderate amount of starch and protein.
D. Solution 4 contains starch and the least reducing sugar.
Answer: A
Benedict's solution tests for reducing sugars. Benedict's reagent is blue. A positive result produces a coloured precipitate ranging from green to yellow, orange, and brick-red, indicating the presence of reducing sugars. The higher the concentration of reducing sugar, the further the colour change goes, from blue (no reducing sugar) towards brick-red (high concentration). A blue result indicates no reducing sugar is present. Heating is required for this test.
Biuret reagent tests for proteins. A purple or lilac colour indicates the presence of protein. A pale blue/pale purple colour indicates low protein. A blue result indicates no protein. The test solution needs to be alkaline.
Iodine solution tests for starch. Iodine dissolved in potassium iodide solution is used. This solution is typically browny-orange or yellow. A dark blue-black colour indicates the presence of starch. If no starch is present, the colour remains browny-orange/yellow.
| solution | Benedict’s solution | biuret reagent | iodine solution | interpretation |
| 1 | brick-red | purple | yellow | high reducing sugar, protein present, no starch |
| 2 | blue | pale blue | blue-black | no reducing sugar, trace protein, starch present |
| 3 | green | pale purple | yellow | low reducing sugar, low protein, no starch |
| 4 | orange | purple | yellow | moderate reducing sugar, protein present, no starch |
A. Correct: Solution 1 contains a high concentration of reducing sugar and protein but no starch. This aligns with the interpretation of the results for Solution 1 (brick-red Benedict's, purple Biuret, yellow Iodine).
B. Incorrect: Solution 2 tested blue with Benedict's, indicating no reducing sugar, not the presence of reducing sugar. Biuret pale blue means trace protein, and Iodine blue-black means starch present.
C. Incorrect: Solution 3 tested yellow with Iodine, indicating no starch, not a moderate amount. Biuret pale purple means low protein, and Benedict’s green means low reducing sugar.
D. Incorrect: Solution 4 tested yellow with Iodine, indicating no starch, not the presence of starch. Benedict’s orange means moderate reducing sugar, not the least (Solution 2 has the least reducing sugar, with a negative result).
Question 2
Which concentrations could be produced by a serial dilution of an `8.00%` glucose solution?
A. `4.00%, 2.00%, 1.00%, 0.50%` and `0.25%`
B. `4.00%, 3.00%, 2.00%, 1.00%` and `0.00%`
C.`6.00%, 4.00%, 2.00%, 1.00%` and `0.50%`
D. `8.00%, 6.00%, 4.00%, 2.00%` and `0.00%`
Answer: A
A serial dilution is a technique used to create a set of solutions where the concentration decreases by the same factor each time.
A. Correct: From the starting `8.00%` solution (which isn't listed in the series itself, but is implied as the starting point), if we dilute it by a factor of `2`, we get `4.00%` (`8.00% // 2= 4.00%`).
Similarly:
`4.00%` to `2.00%`: Dilution factor of `2`
`2.00%` to`1.00%`: Dilution factor of `2`
`1.00%` to `0.50%`: Dilution factor of `2`
`0.50%` to `0.25%`: Dilution factor of `2`
This series shows a consistent dilution factor of `2` between each successive concentration.
B. Incorrect: Assuming a start from `8.00%`
`8.00%` to `4.00%`: Dilution factor of `2`
`4.00%` to `3.00%`: Dilution factor of `4//3`
`3.00%` to `2.00%`: Dilution factor of `3//2`
This is not a serial dilution as the dilution factor is not constant.
C. Incorrect: Assuming a start from `8.00%`
`8.00%` to `6.00%`: Dilution factor of `4//3`
`6.00%` to `4.00%`: Dilution factor of `3//2`
This is not a serial dilution. The factor is not constant throughout the process.
D. Incorrect: Assuming a start from `8.00%`
`8.00%` to `6.00%`: Dilution factor of `4//3`
`6.00%` to `4.00%`: Dilution factor of `3//2`
Similarly, this is not a serial dilution due to inconstant dilution factors.
Question 3
An investigation was carried out into the effect of different treatments on the permeability of the cell surface membranes and tonoplasts of beetroot cells. Beetroot cell vacuoles contain a red pigment. This pigment is unable to pass out of the cells because it cannot diffuse through the tonoplasts or cell surface membranes.
`1 cm^3` cubes were cut from beetroot tissue and washed in running water for `20` minutes to remove any pigment released from damaged cells.
The cubes were then placed in test-tubes with different contents and observed for five minutes.
Which row shows a correct explanation for the observation recorded for one of the treatments?
| treatment | observation | explanation | |
| A. | dilute hydrochloric acid | contents of test-tube stay clear | membrane proteins have been denatured |
| B. | ethanol | contents of test-tube turn red | lipids, including membrane phospholipids, have dissolved |
| C. | water at 20 °C | contents of test-tube stay clear | membrane proteins have been denatured |
| D. | water at 80 °C | contents of test-tube turn red | lipids, including membrane phospholipids, have dissolved |
Answer: B
Beetroot cells contain a red pigment in their vacuoles. This pigment is normally unable to pass out of the cells because it cannot diffuse through the tonoplasts (the membrane surrounding the vacuole) or the cell surface membrane, as these membranes are typically partially permeable.
The procedure involved cutting `1 cm^3` cubes from beetroot tissue and washing them for `20` minutes to remove any pigment released from damaged cells during cutting. The cubes were then placed in test-tubes with different contents for five minutes. Changes in the colour of the surrounding solution indicate that the pigment has leaked out, meaning the membrane permeability has increased.
A. Incorrect: While strong acids can denature proteins, the dilute hydrochloric acid does not affect beetroot cell membrane permeability or pigment leakage. Denaturing membrane proteins would likely increase permeability, causing the solution to turn red, not stay clear. The observation “stay clear” suggests low permeability, while the explanation “proteins have been denatured” suggests increased permeability. These are contradictory.
B. Correct: Increasing the concentration of a solvent such as ethanol (or alcohol, acetone) increases membrane permeability because the solvent dissolves the lipids in the cell membrane, causing it to lose its structure. When cell membrane permeability increases, the red pigment leaks out, causing the surrounding solution to turn red. The observation “contents of test-tube turn red” aligns with increased permeability. The explanation “lipids, including membrane phospholipids, have dissolved” is the mechanism by which solvents increase membrane permeability.
C. Incorrect: Water at 20 °C is a moderate temperature, often used as a baseline or control in such experiments. At such a temperature, the membranes are expected to maintain their normal partially permeable nature, and significant pigment leakage is not expected. Thus, the observation “contents of test-tube stay clear” is expected. However, the explanation “membrane proteins have been denatured” is incorrect; denaturation typically occurs at high temperatures. Proteins are functional at 20°C.
D. Incorrect: Water at 80 °C is a high temperature, causing increased membrane permeability, leading to pigment leakage and the solution turning red. Thus, the observation “contents of test-tube turn red” is expected. However, the explanation states that lipids “have dissolved” is incorrect. High temperature disrupts the membrane structure involving both lipids and proteins (due to increased kinetic energy and protein denaturation), it doesn't dissolve the lipids in the same way a solvent does.
Question 4
Place the following statements about making up `100 cm^3` of a`5%` sucrose solution in the correct order:
1. Make up to `100 cm^3` by adding distilled water.
2. Dissolve in a small amount of distilled water.
3. Place dissolved sucrose into a `100 cm^3` volumetric flask.
4. Use a top pan balance to measure out `5` g of sucrose.
A. 1 2 3 4
B. 3 1 4 2
C. 4 2 3 1
D. 2 4 1 3
Answer: C
Making up a percentage solution involves dissolving a specific mass of the solute in solvent and making the total volume of the solution up to a required amount. For example, a `5%` sucrose solution means there are `5` g of sucrose in a total volume of `100 cm^3` of solution.
The steps for making up `00 cm³` of a `5%` sucrose solution:
This sequence ensures that the correct mass of solute is measured, dissolved, transferred to a volumetric flask for accurate volume measurement, and finally made up to the precise total volume needed for the desired percentage concentration.
Question 5
To decide what concentration of reducing sugar is in a particular solution, we must produce a calibration curve graph using a range of known concentrations. These are created by diluting stocks of reducing sugar solutions of known concentrations.
a. Copy and complete the Table 1 to show how to make a range of concentrations when given a 1% standard solution of sucrose. The first two are done for you.
| Concentration of sucrose / % | Volume of 1% glucose solution / `cm^3` | Volume of added water / cm3 |
| 0.9 | 9 | 1 |
| 0.8 | 8 | 2 |
| 0.7 | ||
| 0.6 | ||
| 0.5 | ||
| 0.4 | ||
| 0.3 | ||
| 0.2 | ||
| 0.1 |
Table 1. How to make a range of concentrations when given a 1% standard solution of sucrose.
To make wider ranges of dilutions you will need to be able to perform serial dilutions. An example of this is shown in the right-hand diagram below.
Figure 1. Producing a range of concentrations from standard solutions.
b. Describe how you could make up the following glucose concentrations when given a 1% standard solution (there may be several different ways for each):
i. `0.02%`
ii. `0.003%`
iii. `0.0005%`
a. The concentration of the diluted solution depends on how much of the stock solution you use and how much water you add. To calculate the volume of the 1% glucose solution needed for a desired final concentration, and the corresponding volume of added water, use the principle of dilution:
`C_1V_1=C_2V_2`
Where:
`C_1`: concentration of stock solution (1%)
`V_1`: volume of stock solution to use (unknown)
`C_2`: desired concentration of diluted solution
`V_2`: total volume of diluted solution (10 cm3)
Rearranged to find`V_1`:
`V_1=(C_2xxV_2)/(C_1)`
| Concentration of sucrose / % | Volume of `1%` glucose solution / `cm^3` | Volume of added water / `cm^3` |
| 0.9 | 9 | 1 |
| 0.8 | 8 | 2 |
| 0.7 | 7 | 3 |
| 0.6 | 6 | 4 |
| 0.5 | 5 | 5 |
| 0.4 | 4 | 6 |
| 0.3 | 3 | 7 |
| 0.2 | 2 | 8 |
| 0.1 | 1 | 9 |
Table 1. How to make a range of concentrations when given a `1%` standard solution of sucrose.
b.
i. To prepare the `0.02%` glucose solution from a `1%` stock solution:
Take 1 `cm^3` of `1%` standard glucose solution, add 9 `cm^3` of distilled water to make `0.1%` solution.
Take 2 `cm^3` of `0.1%` solution, add 8 `cm^3` of distilled water to make `0.02%` solution.
ii. To prepare the `0.003%` glucose solution from a `1%` stock solution:
Take 1 `cm^3` of `1%` standard glucose solution, add 9 `cm^3` of distilled water to make `0.1%` solution.
Take 1 `cm^3` of `0.1%` solution, add 9 `cm^3` of distilled water to make `0.01%` solution.
Take 3 `cm^3` of `0.01%` solution, add 7 `cm^3` of distilled water to make `0.003%` solution.
iii. To prepare the `0.0005%` glucose solution from a `1%` stock solution:
Take 1 `cm^3` of `1%` standard glucose solution, add 9 `cm^3` of distilled water to make`0.1%` solution.
Take 1 `cm^3` of `0.1%` solution, add 9 `cm^3`of distilled water to make `0.01%` solution.
Take 1 `cm^3` of `0.01%` solution, add 9 `cm^3` of distilled water to make `0.001%` solution.
Take 5 `cm^3`of `0.001%` solution, add 5 `cm^3` of distilled water to make `0.0005%` solution.
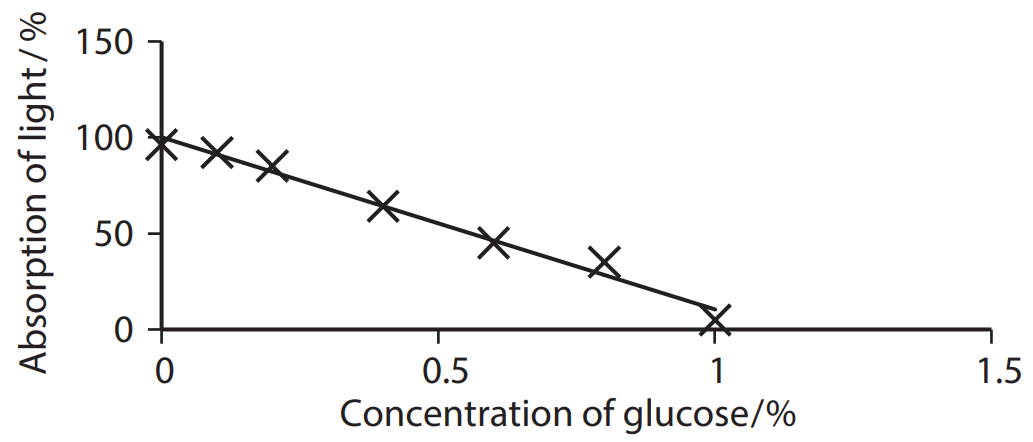
Question 6
A calibration curve is a graph with the known concentrations plotted against their percentage absorbance. The table below shows the percentage of red light absorbed using a colorimeter from Benedict's tests performed on a variety of glucose concentrations.
| Concentration of glucose / % | Absorption of light / % |
| 1.0 | 5 |
| 0.8 | 35 |
| 0.6 | 45 |
| 0.4 | 54 |
| 0.2 | 85 |
| 0.1 | 92 |
| 0.0 | 96 |
A calibration curve of the concentration of glucose against the absorption of light is plotted below.
When comparing different solutions of glucose using this method, it is important to control many factors in order to make a valid comparison.
List three factors that need to be kept constant.
When comparing different solutions of glucose using the Benedict's test and a colorimeter to create a calibration curve, it is important to control several factors to ensure a valid comparison. Any three of the following factors that need to be kept constant are:
Note that keeping these variables constant ensures that the differences in absorbance measurements are solely due to the different concentrations of glucose in the solutions, rather than variations in the test procedure.
Question 7
Like lactose, sucrose is a disaccharide. If you were given a solution of lactose and a solution of sucrose, state briefly how you could distinguish between them.
Distinguish between a solution of lactose and a solution of sucrose by using the Benedict's test. This test is used for identifying reducing sugars.
First, carry out a Benedict's test on both solutions.
Take a sample of each solution (lactose and sucrose). Add Benedict's reagent (which is blue) to each sample. It's important to use excess Benedict's reagent.
Heat both mixtures, typically in a water bath that has been brought to the boil. Heat for a standard time, for example, 5 minutes.
Then observe the results. The Benedict's reagent will form a coloured precipitate if a reducing sugar is present.
Lactose would give a brick-red/brown precipitate. This happens because lactose is a reducing sugar. Reducing sugars reduce the soluble blue copper(II) ions in Benedict's reagent to insoluble brick-red copper(I) oxide.
The solution containing sucrose would remain blue. This is because sucrose is a non-reducing sugar. The aldehyde or ketone groups needed to reduce the copper ions are involved in the glycosidic bond formation in sucrose.
Question 8
When Benedict’s solution is added to a sucrose solution and put into a boiling water-bath, no change in colour is observed.
a. State why no colour change is observed.
b. Describe briefly how to test for the presence of sucrose.
a. When Benedict’s solution is added to a sucrose solution and put into a boiling water-bath, no change in colour is observed. This is because the Benedict's test is used to detect reducing sugars.
Sucrose is a non-reducing sugar. Reducing sugars are able to reduce the soluble blue copper(II) ions in Benedict's reagent to insoluble brick-red copper(I) oxide when heated, forming a coloured precipitate. The colour change from blue to green, yellow, orange, or brick-red indicates a positive result, depending on the concentration of reducing sugar present.
In sucrose, the aldehyde group of glucose and the ketone group of fructose (which are the functional groups responsible for reducing activity) are involved in forming the glycosidic bond that links them together. Because these groups are tied up in the bond, they are not available to reduce the copper(II) ions in the Benedict's test.
Therefore, sucrose does not reduce the copper(II) sulfate in the Benedict's reagent. As a result, the solution remains the initial blue colour of the Benedict's reagent, indicating a negative test for reducing sugars.
b. To test for the presence of sucrose (a non-reducing sugar), firstly break it down into its constituent monosaccharides (glucose and fructose) through hydrolysis. This is typically done by heating the sucrose solution with dilute hydrochloric acid. After hydrolysis, the solution would contain glucose and fructose, both of which are reducing sugars. Then, neutralize the acid and perform the Benedict's test again. If a coloured precipitate forms in this second test, it confirms the presence of a non-reducing sugar that was hydrolysed. However, in the initial test on sucrose without the prior hydrolysis step, the result is negative because sucrose itself is not a reducing sugar.
Question 9
Part 1: Preparing the different concentrations of glucose by serial dilution
It is important to be able to understand how to make different concentrations of solution by using the technique of serial
dilution (Figure 1 shows the beginning of this process).
1. Label the test tubes `1-7`.
2. Using a pipette, place `10 cm^³` `10%` glucose solution into tube 1.
3. Remove 1`cm^³` of this solution from tube 1 and place into tube 2.
4. Add 9 `cm^³` distilled water to tube 2 and mix. This is now diluted to `1%` glucose.
5. Remove 1 `cm^³` of the `1%` glucose solution from tube 2 and place into tube 3.
6. Add 9 `cm^³` distilled water into tube 3 and mix. This is now diluted to `0.1%` glucose.
7. Remove 1 `cm^³` of `0.1%` glucose from tube 3 and place into tube 4.
8. Add 9 `cm^³` distilled water to tube 4 and mix. This is now diluted to `0.01%` glucose.
9. Remove 1 `cm^³`of`0.01%` glucose from tube 4 and place into tube 5.
10. Add 9 `cm^³` distilled water to tube 5 and mix. This is now diluted to `0.001%` glucose.
11. Remove 1 `cm^³` of `0.001%` glucose from tube 5 and place into tube 6.
12. Place 9 `cm^3` distilled water into tube 6.
13. Remove 1 `cm^3` of `0.001%` glucose from tube 6 and throw it away.
Figure 1. Method for serial dilution.
• Part 2: Carrying out the Benedict's test
1. Set up a boiling water bath.
2. Place 9 `cm³` unknown glucose solution into tube 7.
3. Add 5 `cm³` Benedict's solution to each of tubes 1-6.
4. Carefully place tubes 1-6 into the boiling water bath for exactly 5 min.
5. Turn off the Bunsen burner and using a test tube holder, carefully remove the test tubes and place them in a rack in order 1-6.
6. Record the colours of the test tube, or colouring the test tubes in Figure 2 in the Results section below the appropriate colours.
7. Compare the colour of the 'unknown' solution with the colours of the known standards. Identify the concentration of the standards which have the most similar colour. If the colour is not exactly the same as the standard, look at the colours of the solutions with higher and lower concentrations. This can help you to suggest a range within which the concentration lies.
Figure 2. Experimental results from the investigation.
a. Explain why this test is considered a semi-quantitative test rather than a quantitative one.
b. How certain can we be about the exact concentration of glucose in the unknown solution?
c. Why was 1 `cm^3` thrown away from the last dilution?
d. Several variables were kept constant for all the tubes. List as many of these standardised variables as possible and explain why it is essential to keep them constant.
e. It is important that the amount of Benedict's solution added is greater than the glucose. Explain how it could affect the result if there were too little Benedict's solution.
f. Explain the purpose of tube 6.
g. Suggest an alternative method that could be used to make the test fully quantitative.
h. Serial dilution can be used to make many different concentration ranges. This experiment used a dilution factor of 10 each time. Calculate the concentrations of glucose solutions that would have been produced if 5 `cm^3` of water and 5 `cm^3` glucose solution were used each time instead of 9 `cm^3` water and 1 `cm^3` glucose solution.
a. This Benedict’s test is considered semi-quantitative because it provides a rough estimate of reducing sugar concentration based on the color change (blue → green → yellow → orange → brick-red). The result is compared visually to standards of known concentration, allowing you to estimate the concentration, but not measure it precisely. The assessment is subjective and does not yield an exact numerical value.
b. We cannot be completely certain about the exact concentration because the test relies on visual comparison and color perception. The color may not match any standard exactly, and intermediate colors can be difficult to interpret. Therefore, the result is an approximate range rather than a precise value.
c. 1`cm^3` is discarded from the last tube to ensure that all test tubes have the same final volume (10 `cm³`). Each transfer adds extra liquid, so discarding 1 `cm³`maintains consistency across all tubes, which is important for fair comparison of results.
d. Variables kept constant include:
Keeping these variables constant is essential to ensure that differences in color are due only to differences in glucose concentration, not other factors. This makes the experiment fair and results reliable. Otherwise, differences in color could be due to unequal heating or reagent volumes.
e. Benedict’s solution must be in excess so that there’s enough copper(II) ions to react with all reducing sugar present. If there is too little Benedict’s solution, not all the reducing sugar will be detected, leading to an underestimate of the glucose concentration. The color change may be less intense than it should be, making the result inaccurate.
f. Tube 6 serves as the most dilute standard (lowest glucose concentration – 0.0001%). The purpose of tube 6 is to determine the minimum detectable concentration at which a color change can still be observed after the Benedict’s test. It helps to estimate whether the unknown solution has a concentration above or below this most dilute standard.
Note that tube 6 is not a negative control. It helps to assess how minimal concentrations of glucose affect the color change, but since it contains glucose, it is not a true negative control. A negative control in Benedict’s test is typically a tube containing distilled water and Benedict’s reagent only,
with no reducing sugar. This control confirms that the reagents themselves do not produce a color change in the absence of reducing sugars.
g. To make the test fully quantitative, a colorimeter could be used to measure the absorbance or transmission of light through each solution after the Benedict’s test. This allow obtaining numerical data for color intensity. By plotting a calibration curve of absorbance against known glucose concentrations, you can determine the exact concentration of an unknown sample by interpolation.
h. With 5 `cm^3` glucose solution + 5 `cm^3` water, the dilution factor is 2 each time. Starting with 10%:
Tube 1: `10%` (starting solution)
Tube 2: `10% // 2 = 5.0%`
Tube 3: `5.0% // 2 = 2.5%`
Tube 4: `2.5% // 2 = 1.25%`
Tube 5: `1.25% // 2 = 0.625%`
Tube 6: `0.625% // 2 = 0.3125%`
So the concentrations would be: `10%, 5.0%, 2.5%, 1.25%, 0.625%, 0.3125%.`
Question 10
Part 1: Making the standard concentrations of starch
1. Use the same method to make serial dilutions of glucose to make 9 cm3 of each of the following concentrations of starch suspensions starting with a 1% stock:
• 1%
• 0.1%
• 0.01%
• 0.001%
• 0.0001%
Label each of the five test tubes appropriately.
2. Place 9 `cm^3` distilled water into a sixth test tube.
3. Add three drops of iodine solution to each tube and mix.
4. Put all the test tubes into a rack in order of decreasing starch concentration.
5. Either colour each tube the appropriate colour in Figure 2 in the Results section or record the colours of the test tube.
Part 2: Making the banana extracts
1. Label three test tubes, A, B and C.
2. Use a knife to cut out a 1 `cm^3` piece of green, unripe banana (without the peel) and place it into a beaker (see Figure 1).
3. Add 10 `cm^3` distilled water to the beaker and mash the banana with a spatula to make a suspension of banana. Transfer the extract to tube A.
4. Repeat the procedure for the yellow (ripe) and black (over-ripe) bananas, transferring the extracts into tubes B and C respectively.
5. Place all three test tubes into a boiling water bath for 5 min.
6. Remove the tubes from the water bath and leave to cool for 10 min.
7. Add five drops of iodine to each solution, mix and compare each with the standard dilutions.
8. Record the approximate concentrations of starch in each type of banana in the Results section.
Figure 1. Method for part 2 of investigation.
Figure 2. Experimental results for investigation.
a. The approximate starch ranges (the concentrations of the standards within which the colour lies) for each banana are:
• green (unripe): range: …………. to …………………..
• yellow (ripe): range: …………. to …………………..
• black (over-ripe): range: …………. to ………………
b. Explain what the investigation shows you about what happens to bananas as they ripen.
c. Discuss the accuracy of this method and suggest how it could be improved to give more precise values of starch concentrations.
d. Describe four limitations of this investigation. These should not simply be errors but things that mean that the results may not be accurate or the conclusion valid.
a. The approximate starch ranges (the concentrations of the standards within which the colour lies) for each banana are:
• green (unripe): range: 0.1% to 1.0%
• yellow (ripe): range: 0.001% to 0.1%
• black (over-ripe): range: 0.0001% to 0.001%
b. As bananas ripen, starch is broken down into simpler sugars. As ripening progresses, enzymes (like amylase) convert starch into maltose and glucose, which do not react strongly with iodine. This transformation supports why ripe bananas taste sweeter as the starch has been enzymatically digested into reducing sugars.
The green (unripe) banana contains the highest starch concentration (shown by the deep blue-black color with iodine), which gives it a firm texture and less sweetness.
The yellow (ripe) banana shows a much lower starch concentration, indicating starch has been converted to sugars, making the banana sweeter and softer.
The black (over-ripe) banana has very little or almost no starch left, as most starch has been converted, and the banana is very soft and sweet.
This process explains the change in texture and taste during ripening.
c. The iodine test is semi-quantitative, relying on visual color comparison, which is subjective and can vary between observers. Color intensity can be affected by lighting conditions, mixing, and human perception. Also, the starch suspensions may not be perfectly uniform, affecting color consistency.
To improve accuracy:
Use a colorimeter or spectrophotometer to measure absorbance of the iodine-starch complex, producing numeric data.
Calibrate with a standard curve using known starch concentrations to determine exact values for the unknowns (banana extracts).
Perform replicates for each sample to reduce random variation and improve reliability.
Use standardized lighting and color charts to reduce subjective interpretation.
d. Limitations of the investigation are:
• Subjective color interpretation
Visual matching relies on human judgment and perception, which can vary and cause inconsistency.
• Variability in banana samples
Bananas from different plants, batches, or storage conditions may have different starch contents even at the same ripeness, affecting generalizability.
• Unequal mixing or extraction efficiency
Mashing the banana and extracting starch may not be consistent; some starch may remain unextracted or unevenly distributed. These differences can affect how much starch ends up in the solution, leading to variable concentrations.
• Iodine volume and reaction time not standardized
If iodine drops are not precisely measured or mixed evenly, and the reaction time between tubes is not standardized, the reaction strength and final color may vary.
• Iodine reaction specificity
Iodine reacts primarily with starch but can also interact with other polysaccharides or compounds, potentially affecting color intensity and accuracy.
• Effect of other banana components
Other substances in banana extracts (e.g., sugars, organic acids, pigments, fibers) may interfere with the color development or mask the starch-iodine complex color, affecting interpretation.
Note that don’t confuse limitations with errors. Errors can be the results of limitations of techniques or equipment.
Question 1
A student carried out tests on the same volume of four different solutions to investigate the presence of protein, starch and reducing sugar in each.
The results are shown in the table.
| solution | Benedict’s solution | biuret reagent | iodine solution |
| 1 | brick-red | purple | yellow |
| 2 | blue | pale blue | blue-black |
| 3 | green | pale purple | yellow |
| 4 | orange | purple | yellow |
Which conclusion can be drawn from these results?
A. Solution 1 contains a high concentration of reducing sugar and protein but no starch.
B. Solution 2 contains starch and reducing sugar but no protein.
C. Solution 3 contains a moderate amount of starch and protein.
D. Solution 4 contains starch and the least reducing sugar.
Question 2
Which concentrations could be produced by a serial dilution of an `8.00%` glucose solution?
A. `4.00%, 2.00%, 1.00%, 0.50%` and `0.25%`
B. `4.00%, 3.00%, 2.00%, 1.00%` and `0.00%`
C.`6.00%, 4.00%, 2.00%, 1.00%` and `0.50%`
D. `8.00%, 6.00%, 4.00%, 2.00%` and `0.00%`
Question 3
An investigation was carried out into the effect of different treatments on the permeability of the cell surface membranes and tonoplasts of beetroot cells. Beetroot cell vacuoles contain a red pigment. This pigment is unable to pass out of the cells because it cannot diffuse through the tonoplasts or cell surface membranes.
`1 cm^3` cubes were cut from beetroot tissue and washed in running water for `20` minutes to remove any pigment released from damaged cells.
The cubes were then placed in test-tubes with different contents and observed for five minutes.
Which row shows a correct explanation for the observation recorded for one of the treatments?
| treatment | observation | explanation | |
| A. | dilute hydrochloric acid | contents of test-tube stay clear | membrane proteins have been denatured |
| B. | ethanol | contents of test-tube turn red | lipids, including membrane phospholipids, have dissolved |
| C. | water at 20 °C | contents of test-tube stay clear | membrane proteins have been denatured |
| D. | water at 80 °C | contents of test-tube turn red | lipids, including membrane phospholipids, have dissolved |
Question 4
Place the following statements about making up `100 cm^3` of a`5%` sucrose solution in the correct order:
1. Make up to `100 cm^3` by adding distilled water.
2. Dissolve in a small amount of distilled water.
3. Place dissolved sucrose into a `100 cm^3` volumetric flask.
4. Use a top pan balance to measure out `5` g of sucrose.
A. 1 2 3 4
B. 3 1 4 2
C. 4 2 3 1
D. 2 4 1 3
Question 5
To decide what concentration of reducing sugar is in a particular solution, we must produce a calibration curve graph using a range of known concentrations. These are created by diluting stocks of reducing sugar solutions of known concentrations.
a. Copy and complete the Table 1 to show how to make a range of concentrations when given a 1% standard solution of sucrose. The first two are done for you.
| Concentration of sucrose / % | Volume of 1% glucose solution / `cm^3` | Volume of added water / cm3 |
| 0.9 | 9 | 1 |
| 0.8 | 8 | 2 |
| 0.7 | ||
| 0.6 | ||
| 0.5 | ||
| 0.4 | ||
| 0.3 | ||
| 0.2 | ||
| 0.1 |
Table 1. How to make a range of concentrations when given a 1% standard solution of sucrose.
To make wider ranges of dilutions you will need to be able to perform serial dilutions. An example of this is shown in the right-hand diagram below.
Figure 1. Producing a range of concentrations from standard solutions.
b. Describe how you could make up the following glucose concentrations when given a 1% standard solution (there may be several different ways for each):
i. `0.02%`
ii. `0.003%`
iii. `0.0005%`
Question 6
A calibration curve is a graph with the known concentrations plotted against their percentage absorbance. The table below shows the percentage of red light absorbed using a colorimeter from Benedict's tests performed on a variety of glucose concentrations.
| Concentration of glucose / % | Absorption of light / % |
| 1.0 | 5 |
| 0.8 | 35 |
| 0.6 | 45 |
| 0.4 | 54 |
| 0.2 | 85 |
| 0.1 | 92 |
| 0.0 | 96 |
A calibration curve of the concentration of glucose against the absorption of light is plotted below.
When comparing different solutions of glucose using this method, it is important to control many factors in order to make a valid comparison.
List three factors that need to be kept constant.
Question 7
Like lactose, sucrose is a disaccharide. If you were given a solution of lactose and a solution of sucrose, state briefly how you could distinguish between them.
Question 8
When Benedict’s solution is added to a sucrose solution and put into a boiling water-bath, no change in colour is observed.
a. State why no colour change is observed.
b. Describe briefly how to test for the presence of sucrose.
Question 9
Part 1: Preparing the different concentrations of glucose by serial dilution
It is important to be able to understand how to make different concentrations of solution by using the technique of serial
dilution (Figure 1 shows the beginning of this process).
1. Label the test tubes `1-7`.
2. Using a pipette, place `10 cm^³` `10%` glucose solution into tube 1.
3. Remove 1`cm^³` of this solution from tube 1 and place into tube 2.
4. Add 9 `cm^³` distilled water to tube 2 and mix. This is now diluted to `1%` glucose.
5. Remove 1 `cm^³` of the `1%` glucose solution from tube 2 and place into tube 3.
6. Add 9 `cm^³` distilled water into tube 3 and mix. This is now diluted to `0.1%` glucose.
7. Remove 1 `cm^³` of `0.1%` glucose from tube 3 and place into tube 4.
8. Add 9 `cm^³` distilled water to tube 4 and mix. This is now diluted to `0.01%` glucose.
9. Remove 1 `cm^³`of`0.01%` glucose from tube 4 and place into tube 5.
10. Add 9 `cm^³` distilled water to tube 5 and mix. This is now diluted to `0.001%` glucose.
11. Remove 1 `cm^³` of `0.001%` glucose from tube 5 and place into tube 6.
12. Place 9 `cm^3` distilled water into tube 6.
13. Remove 1 `cm^3` of `0.001%` glucose from tube 6 and throw it away.
Figure 1. Method for serial dilution.
• Part 2: Carrying out the Benedict's test
1. Set up a boiling water bath.
2. Place 9 `cm³` unknown glucose solution into tube 7.
3. Add 5 `cm³` Benedict's solution to each of tubes 1-6.
4. Carefully place tubes 1-6 into the boiling water bath for exactly 5 min.
5. Turn off the Bunsen burner and using a test tube holder, carefully remove the test tubes and place them in a rack in order 1-6.
6. Record the colours of the test tube, or colouring the test tubes in Figure 2 in the Results section below the appropriate colours.
7. Compare the colour of the 'unknown' solution with the colours of the known standards. Identify the concentration of the standards which have the most similar colour. If the colour is not exactly the same as the standard, look at the colours of the solutions with higher and lower concentrations. This can help you to suggest a range within which the concentration lies.
Figure 2. Experimental results from the investigation.
a. Explain why this test is considered a semi-quantitative test rather than a quantitative one.
b. How certain can we be about the exact concentration of glucose in the unknown solution?
c. Why was 1 `cm^3` thrown away from the last dilution?
d. Several variables were kept constant for all the tubes. List as many of these standardised variables as possible and explain why it is essential to keep them constant.
e. It is important that the amount of Benedict's solution added is greater than the glucose. Explain how it could affect the result if there were too little Benedict's solution.
f. Explain the purpose of tube 6.
g. Suggest an alternative method that could be used to make the test fully quantitative.
h. Serial dilution can be used to make many different concentration ranges. This experiment used a dilution factor of 10 each time. Calculate the concentrations of glucose solutions that would have been produced if 5 `cm^3` of water and 5 `cm^3` glucose solution were used each time instead of 9 `cm^3` water and 1 `cm^3` glucose solution.
Question 10
Part 1: Making the standard concentrations of starch
1. Use the same method to make serial dilutions of glucose to make 9 cm3 of each of the following concentrations of starch suspensions starting with a 1% stock:
• 1%
• 0.1%
• 0.01%
• 0.001%
• 0.0001%
Label each of the five test tubes appropriately.
2. Place 9 `cm^3` distilled water into a sixth test tube.
3. Add three drops of iodine solution to each tube and mix.
4. Put all the test tubes into a rack in order of decreasing starch concentration.
5. Either colour each tube the appropriate colour in Figure 2 in the Results section or record the colours of the test tube.
Part 2: Making the banana extracts
1. Label three test tubes, A, B and C.
2. Use a knife to cut out a 1 `cm^3` piece of green, unripe banana (without the peel) and place it into a beaker (see Figure 1).
3. Add 10 `cm^3` distilled water to the beaker and mash the banana with a spatula to make a suspension of banana. Transfer the extract to tube A.
4. Repeat the procedure for the yellow (ripe) and black (over-ripe) bananas, transferring the extracts into tubes B and C respectively.
5. Place all three test tubes into a boiling water bath for 5 min.
6. Remove the tubes from the water bath and leave to cool for 10 min.
7. Add five drops of iodine to each solution, mix and compare each with the standard dilutions.
8. Record the approximate concentrations of starch in each type of banana in the Results section.
Figure 1. Method for part 2 of investigation.
Figure 2. Experimental results for investigation.
a. The approximate starch ranges (the concentrations of the standards within which the colour lies) for each banana are:
• green (unripe): range: …………. to …………………..
• yellow (ripe): range: …………. to …………………..
• black (over-ripe): range: …………. to ………………
b. Explain what the investigation shows you about what happens to bananas as they ripen.
c. Discuss the accuracy of this method and suggest how it could be improved to give more precise values of starch concentrations.
d. Describe four limitations of this investigation. These should not simply be errors but things that mean that the results may not be accurate or the conclusion valid.

