Question 1
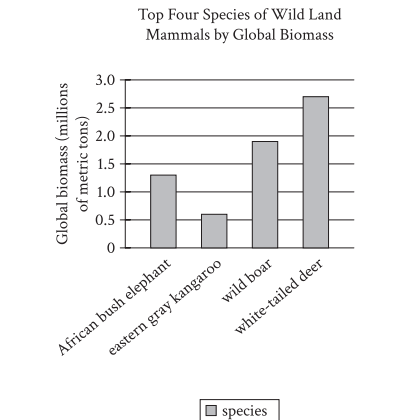
Global biomass is the total mass of living material, such as animals and plants, on Earth. A team of scientists estimated the global biomass, by species, of various wild land mammals. The team found that the species with the highest global biomass is the _______.
(A) wild boar
(B) eastern gray kangaroo
(C) African bush elephant
(D) white-tailed deer
Mark as Complete
Mark Scheme
Question 2
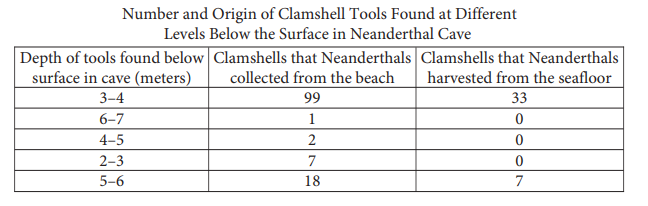
Studying tools unearthed at a cave site on the western coast of Italy, archaeologist Paola Villa and colleagues have determined that prehistoric Neanderthal groups fashioned them from shells of clams that they harvested from the seafloor while wading or diving or that washed up on the beach. Clamshells become thin and eroded as they wash up on the beach, while those on the seafloor are smooth and sturdy, so the research team suspects that Neanderthals prized the tools made with seafloor shells. However, the team also concluded that those tools were likely more challenging to obtain, noting that _______.
(A) at each depth below the surface in the cave, the difference in the numbers of tools of each type suggests that shells were easier to collect from the beach than to harvest from the seafloor.
(B) the highest number of tools were at a depth of 3–4 meters below the surface, which suggests that the Neanderthal population at the site was highest during the related period of time.
(C) at each depth below the surface in the cave, the difference in the numbers of tools of each type suggests that Neanderthals preferred to use clamshells from the beach because of their durability.
(D) the higher number of tools at depths of 5–6 meters below the surface in the cave than at depths of 4–5 meters below the surface suggests that the size of clam populations changed over time.
Mark as Complete
Mark Scheme
Question 3
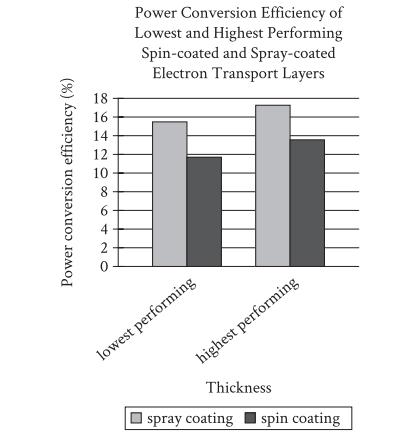
Perovskite solar cells convert light into electricity more efficiently than earlier kinds of solar cells, and manufacturing advances have recently made them commercially attractive. One limitation of the cells, however, has to do with their electron transport layer (ETL), through which absorbed electrons must pass. Often the ETL is applied through a process called spin coating, but such ETLs are fairly inefficient at converting input power to output power. André Taylor and colleagues tested a novel spray coating method for applying the ETL. The team produced ETLs of various thicknesses and concluded that spray coating holds promise for improving the power conversion efficiency of ETLs in perovskite solar cells.
Which choice best describes data from the graph that support Taylor and colleagues’ conclusion?
(A) Both the ETL applied through spin coating and the ETL applied through spray coating showed a power conversion efficiency greater than 10% at their lowest performing thickness.
(B) The lowest performing ETL applied through spray coating had a higher power conversion efficiency than the highest performing ETL applied through spin coating.
(C) The highest performing ETL applied through spray coating showed a power conversion efficiency of approximately 13%, while the highest performing ETL applied through spin coating showed a power conversion efficiency of approximately 11%.
(D) There was a substantial difference in power conversion efficiency between the lowest and highest performing ETLs applied through spray coating.
Mark as Complete
Mark Scheme
Question 4
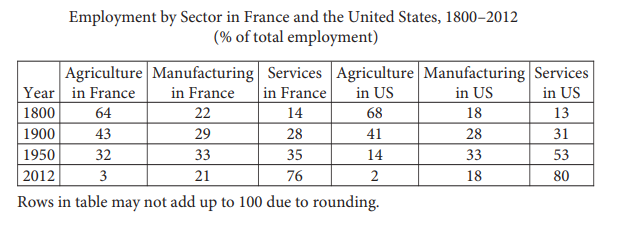
Over the past two hundred years, the percentage of the population employed in the agricultural sector has declined in both France and the United States, while employment in the service sector (which includes jobs in retail, consulting, real estate, etc.) has risen. However, this transition happened at very different rates in the two countries. This can be seen most clearly by comparing the employment by sector in both countries in _______.
(A) 1900 with the employment by sector in 1950.
(B) 1800 with the employment by sector in 2012.
(C) 1900 with the employment by sector in 2012.
(D) 1800 with the employment by sector in 1900.
Mark as Complete
Mark Scheme
Question 5
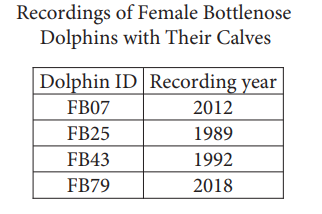
In a study of bottlenose dolphins, biologist Laela S. Sayigh and a team of researchers analyzed recordings of female bottlenose dolphins interacting with their calves.
According to the table, in which year was the dolphin with the ID FB43 recorded with her calf?
(A) 1999
(B) 2012
(C) 2020
(D) 1992
Mark as Complete
Mark Scheme
Question 6
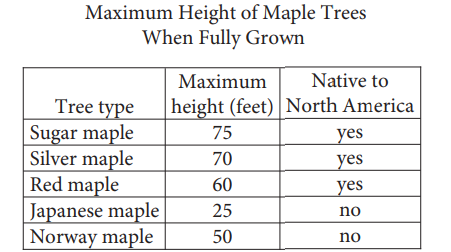
For a school project, a forestry student needs to recommend a maple tree that is native to North America and won’t grow more than 60 feet in height. Based on the characteristics of five common maple trees, she has decided to select a _______
Which choice most effectively uses data from the table to complete the text?
(A) silver maple
(B) sugar maple
(C) red maple
(D) Norway maple
Mark as Complete
Mark Scheme
Question 7
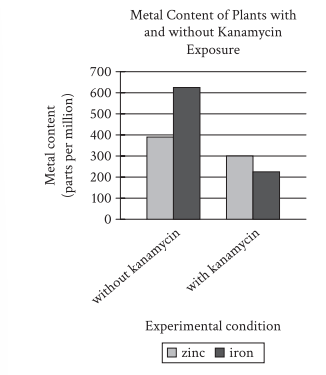
Many plants lose their leaf color when exposed to kanamycin, an antibiotic produced by some soil microorganisms. Spelman College biologist Mentewab Ayalew and her colleagues hypothesized that plants’ response to kanamycin exposure involves altering their uptake of metals, such as iron and zinc. The researchers grew two groups of seedlings of the plant Arabidopsis thaliana, half of which were exposed to kanamycin and half of which were a control group without exposure to kanamycin, and measured the plants’ metal content five days after germination.
Which choice best describes data in the graph that supports Ayalew and her colleagues’ hypothesis?
(A) The control plants contained higher levels of zinc than iron, but plants exposed to kanamycin contained higher levels of iron than zinc.
(B) Both groups of plants contained more than 200 parts per million of both iron and zinc.
(C) Zinc levels were around 300 parts per million in the control plants but nearly 400 parts per million in the plants exposed to kanamycin.
(D) The plants exposed to kanamycin showed lower levels of iron and zinc than the control plants did.
Mark as Complete
Mark Scheme
Question 8
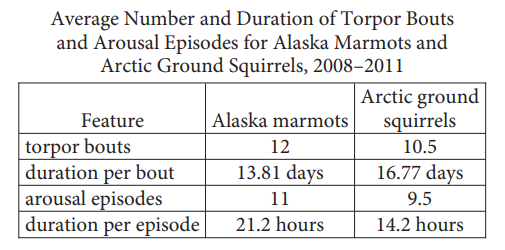
When hibernating, Alaska marmots and Arctic ground squirrels enter a state called torpor, which minimizes the energy their bodies need to function. Often, a hibernating animal will temporarily come out of torpor (called an arousal episode), causing a rise in metabolic rate and burning more energy. Alaska marmots hibernate in groups and therefore burn less energy during arousal episodes than they would if alone. A researcher hypothesized that because Arctic ground squirrels hibernate alone, they would likely exhibit longer bouts of torpor and shorter arousal episodes than Alaska marmots.
Which choice best describes data from the table that support the researcher’s hypothesis?
(A) The Alaska marmots’ arousal episodes lasted for days, while the Arctic ground squirrels’ arousal episodes lasted less than a day.
(B) The Alaska marmots and the Arctic ground squirrels both maintained torpor for several consecutive days per bout, on average.
(C) The Alaska marmots had shorter torpor bouts and longer arousal episodes than the Arctic ground squirrels did.
(D) The Alaska marmots had more torpor bouts than arousal episodes, but their arousal episodes were much shorter than their torpor bouts.
Mark as Complete
Mark Scheme
Question 9
A student studying beehive structure consults data on three species, concluding that _______
Which choice most effectively uses data from the graph to complete the student’s conclusion?
(A) Cells for worker eggs are probably closer in size to cells for drone eggs in the hives of the western honeybee than in the hives of the dwarf honeybee and the black dwarf honeybee.
(B) Both the western honeybee and the black dwarf honeybee probably reserve eight-sided cells for drone eggs, while the dwarf honeybee likely deposits drone eggs in seven-sided cells.
(C) The western honeybee probably relies on many more geometrical shapes when constructing cells than either the dwarf honeybee or the black dwarf honeybee does.
(D) The percentage of hexagonal cells is probably slightly lower in the hives of the western honeybee than in the hives of the dwarf honeybee and the black dwarf honeybee.
Mark as Complete
Mark Scheme
Question 10
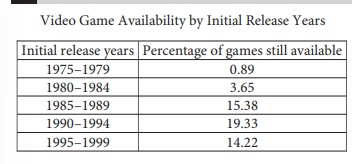
In a recent study, researchers found that relatively few video games released over the decades remain available today. For example, only 14.22 percent of games are still available that were initially released in _______.
Which choice most effectively uses data from the table to complete the statement?
(A) 2000–2004
(B) 1995–1999
(C) 1970–1974
(D) 1985–1989
Mark as Complete
Mark Scheme
Question 11
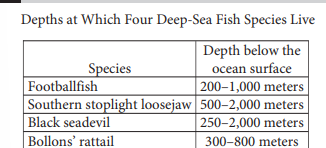
Some oceanic fish species live very deep underwater. Researchers collected data about the depths at which various species live.
Based on the information in the table, at what depth does the southern stoplight loosejaw live?
(A) More than 2,000 meters below the surface
(B) 150 to 400 meters below the surface
(C) 500 to 2,000 meters below the surface
(D) 250 to 500 meters below the surface
Mark as Complete
Mark Scheme
Question 12
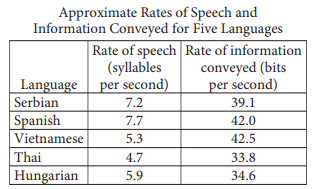
A group of researchers working in Europe, Asia, and Oceania conducted a study to determine how quickly different Eurasian languages are typically spoken (in syllables per second) and how much information they can effectively convey (in bits per second). They found that, although languages vary widely in the speed at which they are spoken, the amount of information languages can effectively convey tends to vary much less. Thus, they claim that two languages with very different spoken rates can nonetheless convey the same amount of information in a given amount of time.
Which choice best describes data from the table that supports the researchers’ claim?
(A) Among the five languages in the table, Thai and Hungarian have the lowest rates of speech and the lowest rates of information conveyed.
(B) Vietnamese conveys information at approximately the same rate as Spanish, despite being spoken at a slower rate.
(C) Among the five languages in the table, the language that is spoken the fastest is also the language that conveys information the fastest.
(D) Serbian and Spanish are spoken at approximately the same rate, but Serbian conveys information faster than Spanish does.
Mark as Complete
Mark Scheme
Question 13
The largest tyrannosaurids—the family of carnivorous dinosaurs that includes Tarbosaurus, Albertosaurus, and, most famously, Tyrannosaurus rex—are thought to have had the strongest bites of any land animals in Earth’s history. Determining the bite force of extinct animals can be difficult, however, and paleontologists Paul Barrett and Emily Rayfield have suggested that an estimate of dinosaur bite force may be significantly influenced by the methodology used in generating that estimate.
Which choice best describes data from the table that support Barrett and Rayfield’s suggestion?
A) The study by Meers used body-mass scaling and produced the lowest estimated maximum bite force, while the study by Cost et al. used muscular and skeletal modeling and produced the highest estimated maximum.
B) In their study, Gignac and Erickson used tooth-bone interaction analysis to produce an estimated bite force range with a minimum of 8,000 newtons and a maximum of 34,000 newtons.
C) The bite force estimates produced by Bates and Falkingham and by Cost et al. were similar to each other, while the estimates produced by Meers and by Gignac and Erickson each differed substantially from any other estimate.
D) The estimated maximum bite force produced by Cost et al. exceeded the estimated maximum produced by Bates and Falkingham, even though both groups of researchers used the same method to generate their estimates.
Mark as Complete
Mark Scheme
Question 14
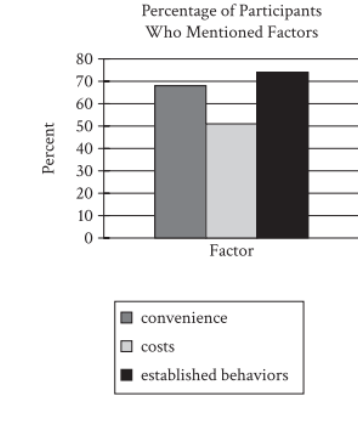
Researcher Judith Hilton and her team interviewed 55 people about which factors would make them switch from using single-use plastic containers to reusable containers. The graph shows three of the factors mentioned in the interviews and the percentage of participants who mentioned them.
According to the graph, about what percentage of participants mentioned costs in the interviews?
(A) 10%
(B) 95%
(C) 25%
(D) 50%
Mark as Complete
Mark Scheme
Question 15
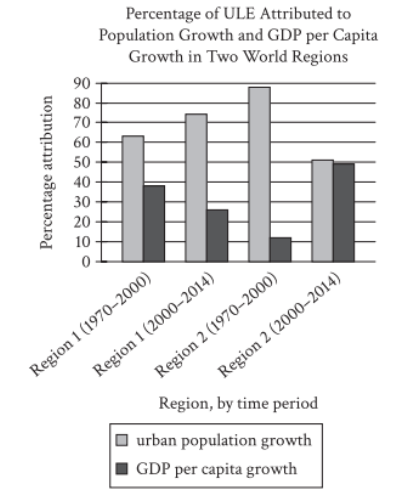
In a study of urban physical expansion, Richa Mahtta et al. conducted a meta-analysis of more than 300 cities worldwide to determine whether urban land expansion (ULE) was more strongly influenced by urban population growth or by growth in gross domestic product (GDP) per capita, a measure of economic activity. Because efficient national government is necessary to provide urban services and infrastructure that attract economic investment, Mahtta et al. propose that absent other factors, the importance of GDP per capita growth to ULE would likely increase relative to the importance of population growth as governments become more efficient. If true, this suggests the possibility that _______.
A) national governments of countries in Region 1 experienced declines in efficiency in the period from 2000 to 2014, relative to the period from 1970 to 2000.
B) countries in Region 1 experienced a slower rate of economic growth in the period from 2000 to 2014 than countries in Region 2 did, despite increasing national government efficiency in Region 1.
C) national governments of most countries in Region 2 became more efficient in the period from 2000 to 2014 than they had been in the period from 1970 to 2000, but those of several countries in this region did not.
D) national governments of countries in Region 1 and in Region 2 generally became more efficient in the period from 2000 to 2014 than they had been in the period from 1970 to 2000, but at different rates.
Mark as Complete
Mark Scheme
Question 16
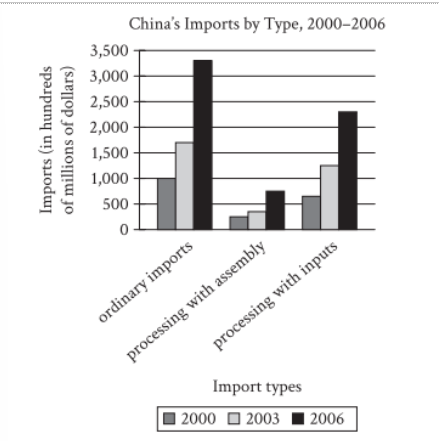
A student is researching the Chinese government’s 1992 shift to a market economy that emphasizes trade liberalization. One means of trade liberalization involves expanding from ordinary imports into an emphasis on processing imports, which have two types: processing with assembly (in which a firm obtains raw materials from a foreign trading partner without payment and sells the final goods to that partner, charging for assembly) and processing with inputs (in which a firm expends capital to buy raw materials from a trading partner, processes them into final goods, and sells those goods to whichever trading partner it chooses). The student asserts that while initial efforts at trade liberalization were shaped by Chinese firms’ limited capital, this situation resolved during the 2000s.
Which choice best describes data from the graph that support the student’s assertion?
A) Processing imports with inputs were greater than both ordinary imports and processing imports with assembly in 2006.
B) From 2000 to 2006, processing imports with inputs rose much more sharply than processing imports with assembly did.
C) From 2000 to 2006, neither processing imports with inputs nor processing imports with assembly were greater than ordinary imports.
D) Processing imports with assembly were greater in 2006 than processing imports with inputs in 2000.
Mark as Complete
Mark Scheme
Question 17
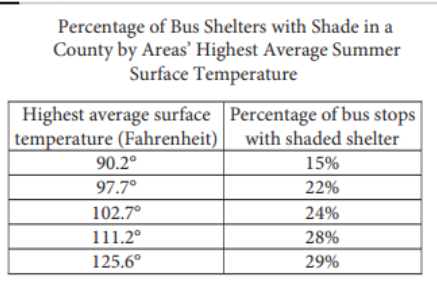
A student is researching a bus system in a large county where surface temperatures vary by area and are hot in the summer. The student claims that all areas of the county should have more bus stops with shaded shelter, noting that the highest percentage of bus stops with shaded shelter for any area is only _______.
Which choice most effectively uses data from the table to complete the student’s claim?
A) 50%
B) 15%
C) 90%
D) 29%
Mark as Complete
Mark Scheme
Question 18
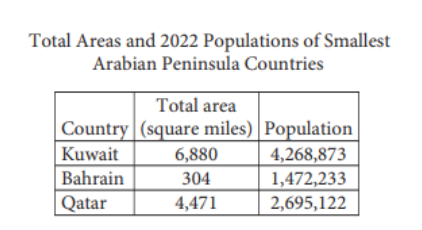
In terms of area and population, the three smallest Arabian Peninsula countries are Bahrain, Qatar, and Kuwait.
According to the table, what is the total area of Bahrain?
A) 4,268,873 square miles
B) 4,471 square miles
C) 304 square miles
D) 6,880 square miles
Mark as Complete
Mark Scheme
Question 19
Approximate Rates of Speech and Information Conveyed for Five Languages
| Language | Rate of speech (syllables per second) | Rate of information conveyed (bits per second) |
| Serbian | 7.2 | 39.1 |
| Spanish | 7.7 | 42.0 |
| Vietnamese | 5.3 | 42.5 |
| Thai | 4.7 | 33.8 |
| Hungarian | 5.9 | 34.6 |
A group of researchers working in Europe, Asia, and Oceania conducted a study to determine how quickly different Eurasian languages are typically spoken (in syllables per second) and how much information they can effectively convey (in bits per second). They found that, although languages vary widely in the speed at which they are spoken, the amount of information languages can effectively convey tends to vary much less. Thus, they claim that two languages with very different spoken rates can nonetheless convey the same amount of information in a given amount of time.
Which choice best describes data from the table that supports the researchers' claim?
A) Among the five languages in the table, Thai and Hungarian have the lowest rates of speech and the lowest rates of information conveyed.
B) Vietnamese conveys information at approximately the same rate as Spanish, despite being spoken at a slower rate.
C) Among the five languages in the table, the language that is spoken the fastest is also the language that conveys information the fastest.
D) Serbian and Spanish are spoken at approximately the same rate, but Serbian conveys information faster than Spanish does.
Medium
Mark as Complete
Mark Scheme
Question 20

To investigate the effect of lizard predation on spider populations, a student in a biology class placed spiders in two enclosures, one with lizards and one without, and tracked the number of spiders in the enclosures for 30 days. The student concluded that the reduction in the spider population count in the enclosure with lizards by day 30 was entirely attributable to the presence of the lizards.
Which choice best describes data from the graph that weakens the student’s conclusion?
A) The spider population count was the same in both enclosures on day 1.
B) The spider population count also substantially declined by day 30 in the enclosure without lizards.
C) The largest decline in spider population count in the enclosure with lizards occurred from day 1 to day 10.
D) The spider population count on day 30 was lower in the enclosure with lizards than in the enclosure without lizards.
Medium
Mark as Complete
Mark Scheme
Question 21
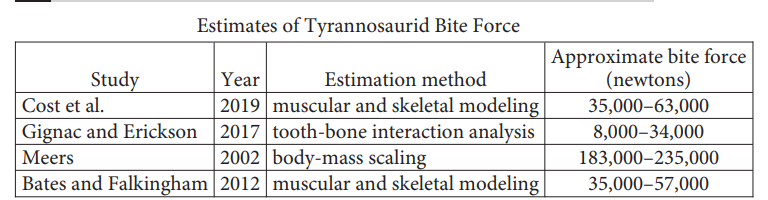
Estimates of Tyrannosaurid Bite Force
| Study | Year | Estimation method | Approximate bite force (newtons) |
| Cost et al. | 2019 | muscular and skeletal modeling | 35,000-63,000 |
| Gignac and Erickson | 2017 | tooth-bone interaction analysis | 8,000-34,000 |
| Meers | 2002 | body-mass scaling | 183,000-235,000 |
| Bates and Falkingham | 2012 | muscular and skeletal modeling | 35,000-57,000 |
The largest tyrannosaurs—the family of carnivorous dinosaurs that includes Tarbosaurus, Albertosaurus, and, most famously, Tyrannosaurus rex—are thought to have had the strongest bites of any land animals in Earth’s history. Determining the bite force of extinct animals can be difficult, however, and paleontologists Paul Barrett and Emily Rayfield have suggested that an estimate of dinosaur bite force may be significantly influenced by the methodology used in generating that estimate.
Which choice best describes data from the table that supports Barrett and Rayfield’s suggestion?
A) The study by Meers used body-mass scaling and produced the lowest estimated maximum bite force, while the study by Cost et al. used muscular and skeletal modeling and produced the highest estimated maximum.
B) In their study, Gignac and Erickson used tooth-bone interaction analysis to produce an estimated bite force range with a minimum of 8,000 newtons and a maximum of 34,000 newtons.
C) The bite force estimates produced by Bates and Falkingham and by Cost et al. were similar to each other, while the estimates produced by Meers and by Gignac and Erickson each differed substantially from any other estimate.
D) The estimated maximum bite force produced by Cost et al. exceeded the estimated maximum produced by Bates and Falkingham, even though both groups of researchers used the same method to generate their estimates.
Medium
Mark as Complete
Mark Scheme
Question 22
Maximum Height of Maple Trees When Fully Grown
| Tree type | Maximum height (feet) | Native to North America |
| Sugar maple | 75 | yes |
| Silver maple | 70 | yes |
| Red maple | 60 | yes |
| Japanese maple | 25 | no |
| Norway maple | 50 | no |
For a school project, a forestry student needs to recommend a maple tree that is native to North America and won’t grow more than 60 feet in height. Based on the characteristics of five common maple trees, she has decided to select a ______.
Which choice most effectively uses data from the table to complete the text?
A) Silver maple
B) Sugar maple
C) Red maple
D) Norway maple
Easy
Mark as Complete
Mark Scheme
Question 23
Characteristics of Five Recently Discovered Gas Exoplanets
| Exoplanet designation | Mass (Jupiters) | Radius (Jupiters) | Orbital period (days) | Distance from the Sun (parsecs) |
| TOI-640 b | 0.88 | 1.771 | 5.003 | 340 |
| TOI-1601 b | 0.99 | 1.239 | 5.331 | 336 |
| TOI-628 b | 6.33 | 1.060 | 3.409 | 178 |
| TOI-1478 b | 0.85 | 1.060 | 10.180 | 153 |
| TOI-1333 b | 2.37 | 1.396 | 4.720 | 200 |
“Hot Jupiters” are gas planets that have a mass of at least 0.25 Jupiters (meaning that their mass is at least 25% of that of Jupiter) and an orbital period of less than 10 days (meaning that they complete one orbit around their star in less than 10 days), while “warm Jupiters” are gas planets that meet the same mass criterion but have orbital periods of more than 10 days. In 2021, Michigan State University astronomer Joseph Rodriguez and colleagues announced the discovery of five new gas exoplanets and asserted that four are hot Jupiters and one is a warm Jupiter.
Which choice best describes data from the table that support Rodriguez and colleagues' assertion?
A) None of the planets have an orbital period of more than 10 days, and TOI-628 b has a mass of 6.33 Jupiters.
B) TOI-1478 b has an orbital period of 153 days, and the masses of all the planets range from 0.85 to 6.33 Jupiters.
C) All the planets have a radius between 1.060 and 1.771 Jupiters, and TOI-1333 b has an orbital period of more than 10 days.
D) Each of the planets has a mass greater than 0.25 Jupiters, and all except for TOI-1478 have an orbital period of less than 10 days.
Medium
Mark as Complete
Mark Scheme
Question 24
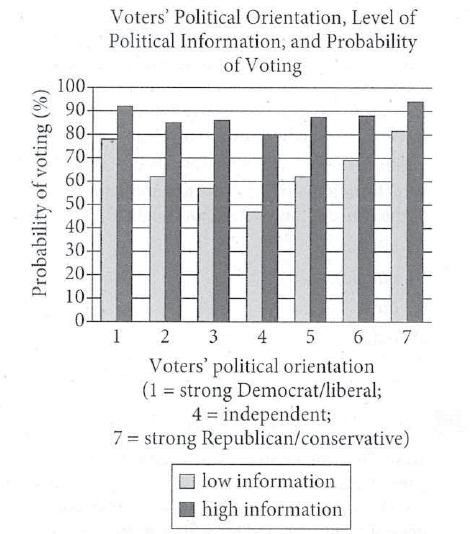
Economists Kerwin Kofi Charles and Melvin Stephens Jr. investigated a variety of factors that influence voter turnout in the United States. Using survey data that revealed whether respondents voted in national elections and how knowledgeable respondents are about politics, Charles and Stephens claim that the likelihood of voting is driven in part by potential voters' confidence in their assessments of candidates—essentially, the more informed voters are about politics, the more confident they are at evaluating whether candidates share their views, and thus the more likely they are to vote.
Which choice best describes data in the graph that supports Charles and Stephens’s claim?
A) At each point on the political orientation scale, high-information voters were more likely than low-information voters to vote.
B) Only low-information voters who identify as independents had a voting probability below 50%.
C) The closer that low-information voters are to the ends of the political orientation scale, the more likely they were to vote.
D) High-information voters were more likely to identify as strong Democrats or strong Republicans than low-information voters were.
Medium
Mark as Complete
Mark Scheme
Question 25
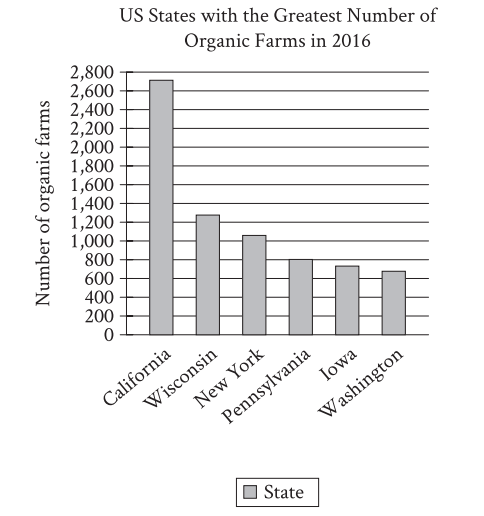
Organic farming is a method of growing food that tries to reduce environmental harm by using natural forms of pest control and avoiding fertilizers made with synthetic materials. Organic farms are still a small fraction of the total farms in the United States, but they have been becoming more popular. According to the US Department of Agriculture, in 2016, California had between 2,600 and 2,800 organic farms and _________.
Which choice most effectively uses data from the graph to complete the text?
A) Washington had between 600 and 800 organic farms.
B) New York had fewer than 800 organic farms.
C) Wisconsin and Iowa each had between 1,200 and 1,400 organic farms.
D) Pennsylvania had more than 1,200 organic farms.
Easy
Mark as Complete
Mark Scheme
Question 26
Ablation Rates for Three Elements in Cosmic Dust, by Dust Source
| Element | SPC | AST | HTC | OCC |
| iron | 20% | 28% | 90% | 98% |
| potassium | 44% | 74% | 97% | 100% |
| sodium | 45% | 75% | 99% | 100% |
Earth’s atmosphere is bombarded by cosmic dust originating from several sources: short-period comets (SPCs), particles from the asteroid belt (ASTs), Halley-type comets (HTCs), and Oort cloud comets (OCCs). Some of the dust’s material vaporizes in the atmosphere in a process called ablation, and the faster the particles move, the higher the rate of ablation. Astrophysicist Juan Diego Carrillo-Sánchez led a team that calculated average ablation rates for elements in the dust (such as iron and potassium) and showed that material in slower-moving SPC or AST dust has a lower rate than the same material in faster-moving HTC or OCC dust. For example, whereas the average ablation rate for iron from AST dust is 28%, the average rate for __________.
Which choice most effectively uses data from the table to complete the example?
A) iron from SPC dust is 20%.
B) sodium from OCC dust is 100%.
C) iron from HTC dust is 90%.
D) sodium from AST dust is 75%.
Medium
Mark as Complete
Mark Scheme
Question 27
Effects of Mycorrhizal on 3 Plant Species
| Plant species | Mycorrhizal host | Average mass of plants grown in soil containing mycorrhizal fungi (in grams) | Average mass of plants grown in soil treated to kill fungi (in grams) |
| Corn | yes | 15.1 | 3.8 |
| Marigold | yes | 10.2 | 2.4 |
| Broccoli | no | 7.5 | 7 |
Mycorrhizal fungi in soil benefits many plants, substantially increasing the mass of some. A student conducted an experiment to illustrate this effect. The student chose three plant species for the experiment, including two that are mycorrhizal hosts (species known to benefit from mycorrhizal fungi) and one nonmycorrhizal species (a species that doesn’t benefit from and may even be harmed by mycorrhizal fungi). The student then grew several plants from each species both in soil containing mycorrhizal fungi and in soil that had been treated to kill mycorrhizal and other fungi. After several weeks, the student measured the plants’ average mass and was surprised to discover ________.
Which choice most effectively uses data from the table to complete the statement?
A) Broccoli grown in soil containing mycorrhizal fungi had a slightly higher average mass than broccoli grown in soil that had been treated to kill fungi.
B) Corn grown in soil containing mycorrhizal fungi had a higher average mass than broccoli grown in soil containing mycorrhizal fungi.
C) Marigolds grown in soil containing mycorrhizal fungi had a much higher average mass than marigolds grown in soil that had been treated to kill fungi.
D) Corn had the highest average mass of all three species grown in soil that had been treated to kill fungi, while marigolds had the lowest.
Medium
Mark as Complete
Mark Scheme
Question 28
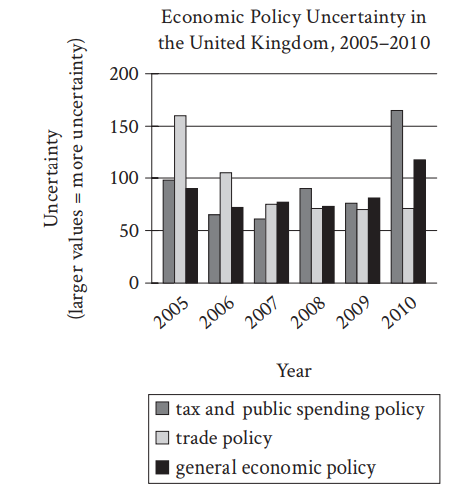
High levels of public uncertainty about which economic policies a country will adopt can make planning difficult for businesses, but measures of such uncertainty have not tended to be very detailed. Recently, however, economist Sandile Hlatshwayo analyzed trends in news reports to derive measures not only for general economic policy uncertainty but also for uncertainty related to specific areas of economic policy, like tax or trade policy. One revelation of her work is that a general measure may not fully reflect uncertainty about specific areas of policy, as in the case of the United Kingdom, where general economic policy uncertainty ________.
Which choice most effectively uses data from the graph to illustrate the claim?
A) aligned closely with uncertainty about tax and public spending policy in 2005 but differed from uncertainty about tax and public spending policy by a large amount in 2009.
B) was substantially lower than uncertainty about tax and public spending policy each year from 2005 to 2010.
C) reached its highest level between 2005 and 2010 in the same year that uncertainty about trade policy and tax and public spending policy reached their lowest levels.
D) was substantially lower than uncertainty about trade policy in 2005 and substantially higher than uncertainty about trade policy in 2010.
Medium
Mark as Complete
Mark Scheme
Question 29
Partial List of Candidate Species for De-extinction
| Common name | Scientific name | Became extinct |
| Huia | Heteralocha acutirostris | 1907 |
| Caribbean monk seal | Monachus tropicalis | 1952 |
| Passenger pigeon | Ectopistes migratorius | 1914 |
| Saber-toothed cat | Smilodon | 11,000 years before present |
| Woolly mammoth | Mammuthus primigenius | 6,400 years before present |
The passage of time is among the many obstacles faced by scientists who are pursuing de-extinction efforts—that is, efforts to use breeding or a mixture of cloning and genetic engineering to bring back extinct species. Specifically, researchers are concerned that the longer a species has been extinct, the less likely it is that a suitable habitat still exists for that species. Among candidate species for de-extinction, this problem would be especially concerning for the ______.
Which choice most effectively uses data from the table to complete the statement?
A) passenger pigeon (Ectopistes migratorius), which became extinct only a few years after the huia (Heteralocha acutirostris).
B) saber-toothed cat (Smilodon), which became extinct 11,000 years ago.
C) woolly mammoth (Mammuthus primigenius), which became extinct several thousand years before the saber-toothed cat (Smilodon).
D) Caribbean monk seal (Monachus tropicalis), which became extinct in 1952.
Easy
Mark as Complete
Mark Scheme
Question 30
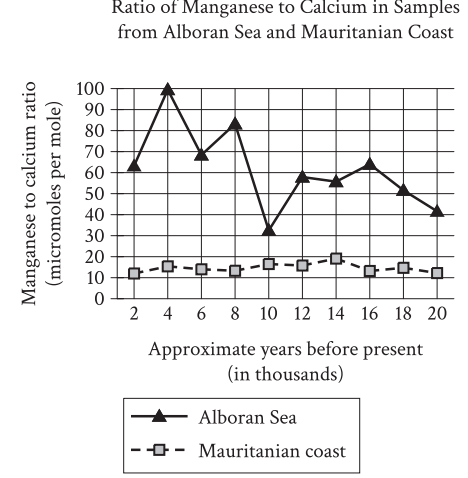 The population of the coral Lophelia pertusa declined significantly around 9,000 years ago in the Alboran Sea and around 11,000 years ago near the Mauritanian coast. Using the ratio of manganese to calcium, which inversely correlates with ocean oxygenation levels, marine scientist Rodrigo da Costa Portilho-Ramos and colleagues evaluated whether oxygenation played a role in the declines of L. pertusa. The researchers concluded that oxygenation may have been important in the Alboran Sea but not near the Mauritanian coast, since ________.
Which choice most effectively uses data from the graph to complete the statement?
A) a substantial increase in oxygenation in the Alboran Sea corresponded with the local decline in L. pertusa, but the opposite relationship between oxygenation and L. pertusa was found near the Mauritanian coast.
B) L. pertusa declined in the Alboran Sea during a period of substantial local decline in oxygenation, but L. pertusa declined near the Mauritanian coast during a period of little local change in oxygenation.
C) oxygenation in the Alboran Sea was higher before the decline in L. pertusa than after the decline, whereas oxygenation near the Mauritanian coast was relatively low both before and after the decline in L. pertusa.
D) oxygenation in the Alboran Sea tended to be substantially higher than oxygenation near the Mauritanian coast during the period studied.
Medium
Mark as Complete
Mark Scheme
Question 31
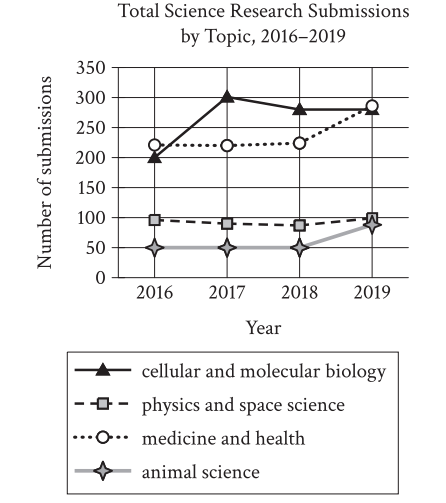
A student is researching the trends in the topics submitted to a national science fair for high school students. The graph shows the number of submissions by topic that were made each year. Based on the data in the graph, the student claims that there were more medicine and health research topics submitted in 2019 than in any other year.
Which choice most effectively uses data from the graph to support the underlined claim?
A) In 2016, the number of cellular and molecular biology topic submissions was the same as the number of animal science topic submissions.
B) In 2019, there were more physics and space science topic submissions than there were medicine and health topic submissions.
C) The lowest number of animal science topic submissions during the period shown was approximately 95 in 2016.
D) The highest number of medicine and health topic submissions during the period shown is approximately 285 in 2019.
Easy
Mark as Complete
Mark Scheme
Question 32
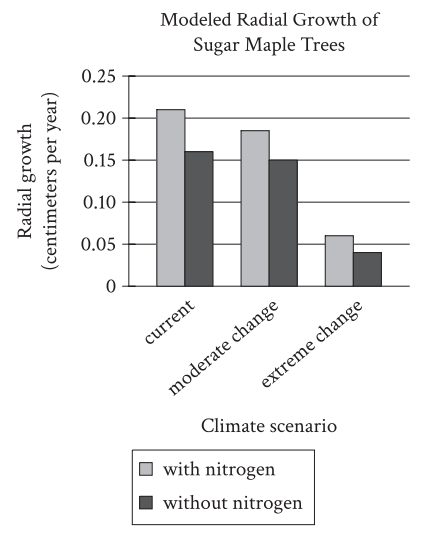
Inés Ibáñez and colleagues studied a forest site in which some sugar maple trees receive periodic fertilization with nitrogen to mimic the broader trend of increasing anthropogenic nitrogen deposition in soil. Ibáñez and colleagues modeled the radial growth of the trees with and without nitrogen fertilization under three different climate scenarios (the current climate, moderate change, and extreme change). Although they found that climate change would negatively affect growth, they concluded that anthropogenic nitrogen deposition could more than offset that effect, provided that the change is moderate rather than extreme.
Which choice best describes data from the graph that supports Ibáñez and colleagues’ conclusion?
A) Growth with nitrogen under the current climate exceeded growth with nitrogen under moderate change, but the latter exceeded growth without nitrogen under extreme change.
B) Growth without nitrogen under the current climate exceeded growth with nitrogen under moderate change, but the latter exceeded growth without nitrogen under extreme change.
C) Growth with nitrogen under moderate change exceeded growth without nitrogen under moderate change, but the latter exceeded growth without nitrogen under extreme change.
D) Growth with nitrogen under moderate change exceeded growth without nitrogen under the current climate, but the latter exceeded growth with nitrogen under extreme change.
Medium
Mark as Complete
Mark Scheme
Question 33
Simulated Change in Annual Aquifer Input and Irrigation Output if
Precipitation Concentration Increases as Climate Models Predict
| Baseline concentration of annual precipitation | % change in water entering aquifers | % change in surface water used for irrigation | % change in groundwater used for irrigation |
| Precipitation is currently somewhat concentrated | 4.9 | 0.4 | 0.9 |
| Precipitation is currently evenly distributed | 11.0 | 9.0 | 7.9 |
Some climate models for the western United States predict that while total annual precipitation may remain unchanged from the present level, precipitation will become concentrated into fewer but more intense rain and snow events. University of Texas climate scientist Geeta Persad and her colleagues simulated how the amount of water entering aquifers and the amount being used for irrigation purposes would change if this were to occur. Persad and her colleagues concluded that the concentration of precipitation into fewer events would result in a higher number of dry days, triggering more irrigation, but that this change in irrigation output is highly sensitive to the baseline concentration of precipitation that currently exists in an area.
Which choice best describes data from the table that supports Persad and her colleagues’ conclusion?
A) If baseline precipitation is somewhat concentrated, the amount of water being used for irrigation will increase 0.4% for surface water and 0.9% for groundwater, whereas the amount of water entering aquifers will increase 11.0% if baseline precipitation is evenly distributed.
B) If baseline precipitation is somewhat concentrated, water use for irrigation will increase only slightly, whereas it will increase 9.0% for surface water and 7.9% for groundwater if baseline precipitation is evenly distributed.
C) If baseline precipitation is somewhat concentrated, the amount of water entering aquifers will increase 4.9%, while the amount being used for irrigation will increase 0.4% for surface water and 0.9% for groundwater.
D) If baseline precipitation is somewhat concentrated, water use for irrigation will decline by a small amount, whereas it will increase 11.0% for surface water and 9.0% for groundwater if baseline precipitation is evenly distributed.
Medium
Mark as Complete
Mark Scheme
Question 34
Ablation Rates for Three Elements in Cosmic Dust, by Dust Source
| Element | SPC | AST | HTC | OCC |
| iron | 20% | 28% | 90% | 98% |
| potassium | 44% | 74% | 97% | 100% |
| sodium | 45% | 75% | 99% | 100% |
Earth's atmosphere is bombarded by cosmic dust originating from several sources: short-period comets (SPCs), particles from the asteroid belt (ASTs), Halley-type comets (HTCs), and Oort cloud comets (OCCs). Some of the dust's material vaporizes in the atmosphere in a process called ablation, and the faster the particles move, the higher the rate of ablation. Astrophysicist Juan Diego Carrillo-Sánchez led a team that calculated average ablation rates for elements in the dust (such as iron and potassium) and showed that material in slower-moving SPC or AST dust has a lower rate than the same material in faster-moving HTC or OCC dust. For example, whereas the average ablation rate for iron from AST dust is 28%, the average rate for __________.
Which choice most effectively uses data from the table to complete the example?
A) iron from SPC dust is 20%
B) sodium from OCC dust is 100%
C) iron from HTC dust is 90%
D) sodium from AST dust is 75%
Medium
Mark as Complete
Mark Scheme
Question 35
High levels of public uncertainty about which economic policies a country will adopt can make planning difficult for businesses, but measures of such uncertainty have not tended to be very detailed. Recently, however, economist Sandile Hlatshwayo analyzed trends in news reports to derive measures not only for general economic policy uncertainty but also for uncertainty related to specific areas of economic policy, like tax or trade policy. One revelation of her work is that a general measure may not fully reflect uncertainty about specific areas of policy, as in the case of the United Kingdom, where general economic policy uncertainty.
Which choice most effectively uses data from the graph to illustrate the claim?
A) aligned closely with uncertainty about tax and public spending policy in 2005 but differed from uncertainty about tax and public spending policy by a large amount in 2009.
B) was substantially lower than uncertainty about tax and public spending policy from 2005 to 2010.
C) reached its highest level between 2005 and 2010 in the same year that uncertainty about trade policy and tax and public spending policy reached their lowest levels.
D) was substantially lower than uncertainty about trade policy in 2005, but reached similar levels in 2009.
Medium
Mark as Complete
Mark Scheme
Question 36
Average Number and Duration of Torpor Bouts and Arousal Episodes for Alaska Marmots
and Arctic Ground Squirrels, 2008-2011
| Feature | Alaska marmots | Arctic ground squirrels |
| torpor bouts | 12 | 10.5 |
| duration per bout | 13.81 days | 16.77 days |
| arousal episodes | 11 | 9.5 |
| duration per episode | 21.2 hours | 14.2 hours |
When hibernating, Alaska marmots and Arctic ground squirrels enter a state called torpor, which minimizes the energy their bodies need to function. Often, a hibernating animal will temporarily come out of torpor (called an arousal episode) and its metabolic rate will rise, burning more of the precious energy the animal needs to survive the winter. Alaska marmots hibernate in groups and therefore burn less energy keeping warm during these episodes than they would if they were alone. A researcher hypothesized that because Arctic ground squirrels hibernate alone, they would likely exhibit longer bouts of torpor and shorter arousal episodes than Alaska marmots.
Which choice best describes data from the table that supports the researcher’s hypothesis?
A) The Alaska marmots’ arousal episodes lasted for days, while the Arctic ground squirrels’ arousal episodes lasted less than a day.
B) The Alaska marmots and the Arctic ground squirrels both maintained torpor for several consecutive days per bout, on average.
C) The Alaska marmots had shorter torpor bouts and longer arousal episodes than the Arctic ground squirrels did.
D) The Alaska marmots had more torpor bouts than arousal episodes, but their arousal episodes were much shorter than their torpor bouts.
Medium
Mark as Complete
Mark Scheme
Question 37
Employment by Sector in France and the United States, 1800–2012
(% of total employment)
| Year | Agriculture in France | Manufacturing in France | Services in France | Agriculture in US | Manufacturing in US | Services in US |
| 1800 | 64 | 22 | 14 | 68 | 18 | 13 |
| 1900 | 43 | 29 | 28 | 41 | 28 | 31 |
| 1950 | 32 | 33 | 35 | 14 | 33 | 53 |
| 2012 | 3 | 21 | 76 | 2 | 18 | 80 |
Over the past two hundred years, the percentage of the population employed in the agricultural sector has declined in both France and the United States, while employment in the service sector (which includes jobs in retail, consulting, real estate, etc.) has risen. However, this transition happened at very different rates in the two countries. This transition can be seen most clearly by comparing the employment by sector in both countries in ______
Which choice most effectively uses data from the table to complete the statement?
A) 1900 with the employment by sector in 1950.
B) 1800 with the employment by sector in 2012.
C) 1900 with the employment by sector in 2012.
D) 1800 with the employment by sector in 1900.
Medium
Mark as Complete
Mark Scheme
Question 38
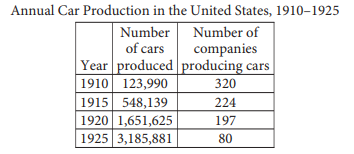
A student is using the table as part of a social studies class presentation on the US auto industry in the early twentieth century. The student notes that, according to the table, from 1910 to 1925 _______
A) the number of cars produced increased but the number of companies producing cars decreased.
B) both the number of cars produced and the number of companies producing cars remained unchanged.
C) the number of cars produced decreased but the number of companies producing cars remained unchanged.
D) both the number of cars produced and the number of companies producing cars increased.
Mark as Complete
Mark Scheme
Question 39
To investigate potential cognitive benefits of taking leave from work, psychologist Jan Packer and colleagues conducted a six-month study.
Which choice best describes data from the graph that support the researchers’ conclusion?
A) In the second test administration, participants who took 2–4 days of leave had higher average attentiveness scores than did those who took no leave, but in the third test administration, those who took no leave had higher average scores than those who took 1–5 weeks of leave.
B) In the first test administration, participants who took 2–4 days of leave had lower average attentiveness scores than did those who took 1–5 weeks of leave and those who took no leave.
C) In both the second and third test administrations, participants who took 2–4 days of leave had higher average attentiveness scores than did participants who took 1–5 weeks of leave.
D) In the second and third test administrations, participants who took 2–4 days of leave had higher average attentiveness scores than did those who took no leave.
Mark as Complete
Mark Scheme
Question 40
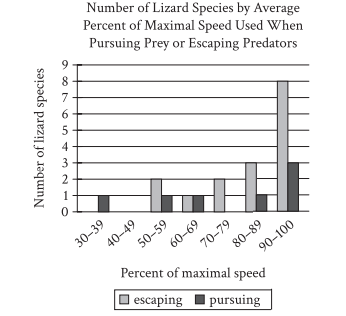
It may seem that the optimal strategy... as evidenced by the fact that _______
Which choice most effectively uses data from the graph to complete the text?
A) most lizard species use about the same percentage of their maximal speed when escaping predation as they do when pursuing prey.
B) multiple lizard species move at an average of less than 90% of their maximal speed while escaping predation.
C) more lizard species use, on average, 90%–100% of their maximal speed while escaping predation than use any other percentage of their maximal speed.
D) at least 4 lizard species use, on average, less than 100% of their maximal speed while pursuing prey.
Mark as Complete
Mark Scheme
Question 41
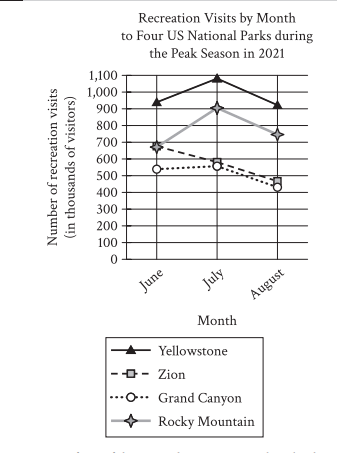
In 2021, four of the United States national parks that were among the most visited were Grand Canyon National Park, Rocky Mountain National Park, Yellowstone National Park, and Zion National Park. The graph shows the number of visits for recreation to each of these parks during the three-month period with the highest number of visitors. A student notes that among the parks shown in the graph, the park with the highest monthly recreation visits in all three months was _______
Which choice most effectively uses data from the graph to complete the text?
A) Zion National Park
B) Rocky Mountain National Park
C) Yellowstone National Park
D) Grand Canyon National Park
Mark as Complete
Mark Scheme
Question 42
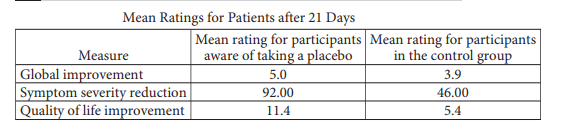
To test whether a medication is effective, scientists compare outcomes for patients taking it and patients taking a placebo (a medically inactive substance). Patients normally aren’t told they’re receiving a placebo, but a research team conducted a study to see if there might be a medical benefit to telling them. The team used various measures to evaluate participants, with higher ratings indicating greater well-being in each measure. Compared to the mean ratings after 21 days for participants in the control group, the mean ratings for participants who were aware of taking a placebo _______
Which choice most effectively uses data from the table to complete the statement?
A) ranged from 5.0 to 92.00, indicating that well-being varied widely from participant to participant.
B) were lower for two measures, with the rating for only one measure indicating greater well-being for these participants.
C) ranged from 3.9 to 46.00, with no rating indicating greater well-being in any measure for these participants.
D) were higher for all three measures, indicating greater overall well-being for these participants. "
Mark as Complete
Mark Scheme
Question 1
Global biomass is the total mass of living material, such as animals and plants, on Earth. A team of scientists estimated the global biomass, by species, of various wild land mammals. The team found that the species with the highest global biomass is the _______.
(A) wild boar
(B) eastern gray kangaroo
(C) African bush elephant
(D) white-tailed deer
(A) Incorrect – The wild boar has a high biomass (~1.9 million metric tons) but not the highest.
(B) Incorrect – The eastern gray kangaroo has the lowest biomass (~0.6 million metric tons).
(C) Incorrect – The African bush elephant’s biomass (~1.3 million metric tons) is not the highest.
(D) Correct – The white-tailed deer has the highest biomass (~2.7 million metric tons).
Question 2
Studying tools unearthed at a cave site on the western coast of Italy, archaeologist Paola Villa and colleagues have determined that prehistoric Neanderthal groups fashioned them from shells of clams that they harvested from the seafloor while wading or diving or that washed up on the beach. Clamshells become thin and eroded as they wash up on the beach, while those on the seafloor are smooth and sturdy, so the research team suspects that Neanderthals prized the tools made with seafloor shells. However, the team also concluded that those tools were likely more challenging to obtain, noting that _______.
(A) at each depth below the surface in the cave, the difference in the numbers of tools of each type suggests that shells were easier to collect from the beach than to harvest from the seafloor.
(B) the highest number of tools were at a depth of 3–4 meters below the surface, which suggests that the Neanderthal population at the site was highest during the related period of time.
(C) at each depth below the surface in the cave, the difference in the numbers of tools of each type suggests that Neanderthals preferred to use clamshells from the beach because of their durability.
(D) the higher number of tools at depths of 5–6 meters below the surface in the cave than at depths of 4–5 meters below the surface suggests that the size of clam populations changed over time.
(A) Correct – The data show more tools from beach shells than seafloor shells, supporting the idea that seafloor shells were harder to obtain.
(B) Incorrect – Population size at different depths does not explain tool preference.
(C) Incorrect – The claim about beach shells being more durable contradicts the passage.
(D) Incorrect – Changes in clam populations don’t explain the tool count differences.
Question 3
Perovskite solar cells convert light into electricity more efficiently than earlier kinds of solar cells, and manufacturing advances have recently made them commercially attractive. One limitation of the cells, however, has to do with their electron transport layer (ETL), through which absorbed electrons must pass. Often the ETL is applied through a process called spin coating, but such ETLs are fairly inefficient at converting input power to output power. André Taylor and colleagues tested a novel spray coating method for applying the ETL. The team produced ETLs of various thicknesses and concluded that spray coating holds promise for improving the power conversion efficiency of ETLs in perovskite solar cells.
Which choice best describes data from the graph that support Taylor and colleagues’ conclusion?
(A) Both the ETL applied through spin coating and the ETL applied through spray coating showed a power conversion efficiency greater than 10% at their lowest performing thickness.
(B) The lowest performing ETL applied through spray coating had a higher power conversion efficiency than the highest performing ETL applied through spin coating.
(C) The highest performing ETL applied through spray coating showed a power conversion efficiency of approximately 13%, while the highest performing ETL applied through spin coating showed a power conversion efficiency of approximately 11%.
(D) There was a substantial difference in power conversion efficiency between the lowest and highest performing ETLs applied through spray coating.
(A) Incorrect – Both ETL methods showed over 10% efficiency, but this doesn’t highlight spray coating’s advantage.
(B) Correct – The lowest-performing spray-coated ETL outperformed the best spin-coated ETL, proving its efficiency.
(C) Incorrect – The efficiency values for spray and spin coatings are misreported.
(D) Incorrect – The conclusion compares spray to spin coating, not just variations within spray coating.
Question 4
Over the past two hundred years, the percentage of the population employed in the agricultural sector has declined in both France and the United States, while employment in the service sector (which includes jobs in retail, consulting, real estate, etc.) has risen. However, this transition happened at very different rates in the two countries. This can be seen most clearly by comparing the employment by sector in both countries in _______.
(A) 1900 with the employment by sector in 1950.
(B) 1800 with the employment by sector in 2012.
(C) 1900 with the employment by sector in 2012.
(D) 1800 with the employment by sector in 1900.
(A) Correct – Comparing 1900 to 1950 best shows the difference in the transition rates between France and the US.
(B) Incorrect – Comparing 1800 to 2012 shows similar transition rates, not different ones.
(C) Incorrect – Comparing 1900 to 2012 shows a similar transition rate, not different ones.
(D) Incorrect – Comparing 1800 to 1900 does not highlight the faster change in the US.
Question 5
In a study of bottlenose dolphins, biologist Laela S. Sayigh and a team of researchers analyzed recordings of female bottlenose dolphins interacting with their calves.
According to the table, in which year was the dolphin with the ID FB43 recorded with her calf?
(A) 1999
(B) 2012
(C) 2020
(D) 1992
(A) Incorrect – The table does not show any dolphin recorded in 1999.
(B) Incorrect – The table shows that the dolphin with ID FB07, not FB43, was recorded in 2012.
(C) Incorrect – The table does not list any dolphins recorded in 2020.
(D) Correct – The table confirms that FB43 was recorded with her calf in 1992.
Question 6
For a school project, a forestry student needs to recommend a maple tree that is native to North America and won’t grow more than 60 feet in height. Based on the characteristics of five common maple trees, she has decided to select a _______
Which choice most effectively uses data from the table to complete the text?
(A) silver maple
(B) sugar maple
(C) red maple
(D) Norway maple
(A) Incorrect – The silver maple has a maximum height of 70 feet, which exceeds the limit.
(B) Incorrect – The sugar maple has a maximum height of 75 feet, which exceeds the limit.
(C) Correct – The red maple is native to North America and does not exceed the height requirement.
(D) Incorrect – The Norway maple is not native to North America.
Question 7
Many plants lose their leaf color when exposed to kanamycin, an antibiotic produced by some soil microorganisms. Spelman College biologist Mentewab Ayalew and her colleagues hypothesized that plants’ response to kanamycin exposure involves altering their uptake of metals, such as iron and zinc. The researchers grew two groups of seedlings of the plant Arabidopsis thaliana, half of which were exposed to kanamycin and half of which were a control group without exposure to kanamycin, and measured the plants’ metal content five days after germination.
Which choice best describes data in the graph that supports Ayalew and her colleagues’ hypothesis?
(A) The control plants contained higher levels of zinc than iron, but plants exposed to kanamycin contained higher levels of iron than zinc.
(B) Both groups of plants contained more than 200 parts per million of both iron and zinc.
(C) Zinc levels were around 300 parts per million in the control plants but nearly 400 parts per million in the plants exposed to kanamycin.
(D) The plants exposed to kanamycin showed lower levels of iron and zinc than the control plants did.
(A) Incorrect – The graph does not show that the plants exposed to kanamycin contained higher levels of iron than zinc.
(B) Incorrect – While both groups had over 200 ppm of iron and zinc, this statement does not highlight the key finding that kanamycin exposure lowered metal levels.
(C) Incorrect – The graph actually shows that control plants had around 400 ppm of zinc, while exposed plants had about 300 ppm, not the reverse.
(D) Correct – The plants exposed to kanamycin had lower iron and zinc levels than the control group, supporting the researchers' hypothesis.
Question 8
When hibernating, Alaska marmots and Arctic ground squirrels enter a state called torpor, which minimizes the energy their bodies need to function. Often, a hibernating animal will temporarily come out of torpor (called an arousal episode), causing a rise in metabolic rate and burning more energy. Alaska marmots hibernate in groups and therefore burn less energy during arousal episodes than they would if alone. A researcher hypothesized that because Arctic ground squirrels hibernate alone, they would likely exhibit longer bouts of torpor and shorter arousal episodes than Alaska marmots.
Which choice best describes data from the table that support the researcher’s hypothesis?
(A) The Alaska marmots’ arousal episodes lasted for days, while the Arctic ground squirrels’ arousal episodes lasted less than a day.
(B) The Alaska marmots and the Arctic ground squirrels both maintained torpor for several consecutive days per bout, on average.
(C) The Alaska marmots had shorter torpor bouts and longer arousal episodes than the Arctic ground squirrels did.
(D) The Alaska marmots had more torpor bouts than arousal episodes, but their arousal episodes were much shorter than their torpor bouts.
(A) Incorrect – Both species had arousal episodes lasting less than a day.
(B) Incorrect – This only states that both species hibernate for several days but does not support the comparison in the hypothesis.
(C) Correct – This directly supports the hypothesis by showing that Alaska marmots had shorter torpor and longer arousal episodes.
(D) Incorrect – This only describes Alaska marmots, not comparing them to Arctic ground squirrels.
Question 9
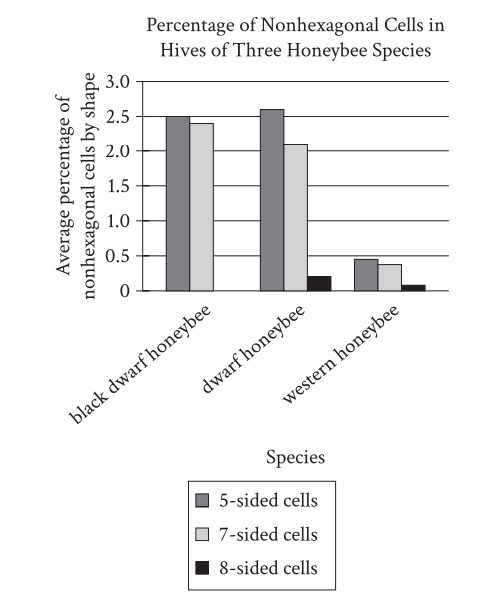
A student studying beehive structure consults data on three species, concluding that _______
Which choice most effectively uses data from the graph to complete the student’s conclusion?
(A) Cells for worker eggs are probably closer in size to cells for drone eggs in the hives of the western honeybee than in the hives of the dwarf honeybee and the black dwarf honeybee.
(B) Both the western honeybee and the black dwarf honeybee probably reserve eight-sided cells for drone eggs, while the dwarf honeybee likely deposits drone eggs in seven-sided cells.
(C) The western honeybee probably relies on many more geometrical shapes when constructing cells than either the dwarf honeybee or the black dwarf honeybee does.
(D) The percentage of hexagonal cells is probably slightly lower in the hives of the western honeybee than in the hives of the dwarf honeybee and the black dwarf honeybee.
(A) Correct – The graph supports the conclusion that the size difference between worker and drone egg cells is smaller in the western honeybee than in the other two species.
(B) Incorrect – The passage states that honeybee eggs are deposited in hexagonal cells, not nonhexagonal ones. Thus, drone eggs would not be placed in eight-sided or seven-sided cells.
(C) Incorrect – The graph shows that the western honeybee does not use more geometric shapes than the other species. It uses the same nonhexagonal shapes as the dwarf honeybee (five-sided, seven-sided, and eight-sided cells), meaning it does not rely on "many more" shapes.
(D) Incorrect – The graph indicates that the western honeybee has a lower percentage of nonhexagonal cells than the other species, which means it must have a higher percentage of hexagonal cells, not lower.
Question 10
In a recent study, researchers found that relatively few video games released over the decades remain available today. For example, only 14.22 percent of games are still available that were initially released in _______.
Which choice most effectively uses data from the table to complete the statement?
(A) 2000–2004
(B) 1995–1999
(C) 1970–1974
(D) 1985–1989
(A) Incorrect – The years 2000–2004 are not represented in the table.
(B) Correct – The table shows that only 14.22% of games from 1995–1999 remain available.
(C) Incorrect – The years 1970–1974 are not represented in the table.
(D) Incorrect – 15.38% of games from 1985–1989 remain available, not 14.22%.
Question 11
Some oceanic fish species live very deep underwater. Researchers collected data about the depths at which various species live.
Based on the information in the table, at what depth does the southern stoplight loosejaw live?
(A) More than 2,000 meters below the surface
(B) 150 to 400 meters below the surface
(C) 500 to 2,000 meters below the surface
(D) 250 to 500 meters below the surface
(A) Incorrect – The table indicates that the southern stoplight loosejaw lives at depths of 500–2,000 meters, not beyond 2,000 meters.
(B) Incorrect – The depth range 150–400 meters does not match the data.
(C) Correct – The table shows that the southern stoplight loosejaw lives 500–2,000 meters below the ocean surface.
(D) Incorrect – The depth range 250–500 meters does not match the data.
Question 12
A group of researchers working in Europe, Asia, and Oceania conducted a study to determine how quickly different Eurasian languages are typically spoken (in syllables per second) and how much information they can effectively convey (in bits per second). They found that, although languages vary widely in the speed at which they are spoken, the amount of information languages can effectively convey tends to vary much less. Thus, they claim that two languages with very different spoken rates can nonetheless convey the same amount of information in a given amount of time.
Which choice best describes data from the table that supports the researchers’ claim?
(A) Among the five languages in the table, Thai and Hungarian have the lowest rates of speech and the lowest rates of information conveyed.
(B) Vietnamese conveys information at approximately the same rate as Spanish, despite being spoken at a slower rate.
(C) Among the five languages in the table, the language that is spoken the fastest is also the language that conveys information the fastest.
(D) Serbian and Spanish are spoken at approximately the same rate, but Serbian conveys information faster than Spanish does.
(A) Incorrect – The claim that Thai and Hungarian have the lowest rates of speech and information conveyed is inaccurate. Hungarian is spoken at 5.9 syllables per second, faster than Vietnamese (5.3 syllables per second). Additionally, even if true, this statement does not support the claim that languages can convey similar information at different spoken rates.
(B) Correct – The table shows that Vietnamese is spoken at 5.3 syllables per second, while Spanish is spoken at 7.7 syllables per second. However, both convey information at nearly the same rate: Vietnamese at 42.5 bits per second and Spanish at 42.0 bits per second. This directly supports the claim that languages with different spoken rates can convey the same amount of information.
(C) Incorrect – The fastest-spoken language (Spanish, at 7.7 syllables per second) does not convey information the fastest. Vietnamese conveys information faster (42.5 bits per second) than Spanish (42.0 bits per second). Additionally, even if this statement were true, it would not support the claim about languages with different spoken rates conveying similar amounts of information.
(D) Incorrect – Serbian is spoken at approximately the same rate as Spanish but conveys information at a slower rate (39.1 bits per second vs. 42.0 bits per second for Spanish). This contradicts the claim rather than supporting it.
Question 13
The largest tyrannosaurids—the family of carnivorous dinosaurs that includes Tarbosaurus, Albertosaurus, and, most famously, Tyrannosaurus rex—are thought to have had the strongest bites of any land animals in Earth’s history. Determining the bite force of extinct animals can be difficult, however, and paleontologists Paul Barrett and Emily Rayfield have suggested that an estimate of dinosaur bite force may be significantly influenced by the methodology used in generating that estimate.
Which choice best describes data from the table that support Barrett and Rayfield’s suggestion?
A) The study by Meers used body-mass scaling and produced the lowest estimated maximum bite force, while the study by Cost et al. used muscular and skeletal modeling and produced the highest estimated maximum.
B) In their study, Gignac and Erickson used tooth-bone interaction analysis to produce an estimated bite force range with a minimum of 8,000 newtons and a maximum of 34,000 newtons.
C) The bite force estimates produced by Bates and Falkingham and by Cost et al. were similar to each other, while the estimates produced by Meers and by Gignac and Erickson each differed substantially from any other estimate.
D) The estimated maximum bite force produced by Cost et al. exceeded the estimated maximum produced by Bates and Falkingham, even though both groups of researchers used the same method to generate their estimates.
A) Incorrect – This misrepresents the data. While Meers and Cost et al. used different methods and produced different estimates, Meers did not produce the lowest maximum bite force; instead, Meers estimated the highest maximum bite force (235,000 newtons), not the lowest.
B) Incorrect – While the bite force estimates from Gignac and Erickson’s study are accurately described, this does not support the claim that methodology significantly affects results. A single study using one method cannot demonstrate variation across different methods.
C) Correct – The table shows that the bite force estimates from Bates and Falkingham and Cost et al. were similar (both using muscular and skeletal modeling), while the estimates from Meers (body-mass scaling) and Gignac and Erickson (tooth-bone interaction analysis) were significantly different. This directly supports the claim that different methodologies produce significantly different estimates.
D) Incorrect – While Cost et al.’s maximum estimate was slightly higher than Bates and Falkingham’s, both used the same method and produced similar estimates. This does not support the claim that methodology significantly affects estimates.
Question 14
Researcher Judith Hilton and her team interviewed 55 people about which factors would make them switch from using single-use plastic containers to reusable containers. The graph shows three of the factors mentioned in the interviews and the percentage of participants who mentioned them.
According to the graph, about what percentage of participants mentioned costs in the interviews?
(A) 10%
(B) 95%
(C) 25%
(D) 50%
(A) Incorrect – The graph shows that about 50% of participants mentioned costs, not 10%.
(B) Incorrect – The graph indicates that only about 50% of participants mentioned costs, not 95%.
(C) Incorrect – The graph demonstrates that around 50% of participants mentioned costs, not 25%.
(D) Correct – The graph clearly shows that about 50% of participants cited costs as a factor.
Question 15
In a study of urban physical expansion, Richa Mahtta et al. conducted a meta-analysis of more than 300 cities worldwide to determine whether urban land expansion (ULE) was more strongly influenced by urban population growth or by growth in gross domestic product (GDP) per capita, a measure of economic activity. Because efficient national government is necessary to provide urban services and infrastructure that attract economic investment, Mahtta et al. propose that absent other factors, the importance of GDP per capita growth to ULE would likely increase relative to the importance of population growth as governments become more efficient. If true, this suggests the possibility that _______.
A) national governments of countries in Region 1 experienced declines in efficiency in the period from 2000 to 2014, relative to the period from 1970 to 2000.
B) countries in Region 1 experienced a slower rate of economic growth in the period from 2000 to 2014 than countries in Region 2 did, despite increasing national government efficiency in Region 1.
C) national governments of most countries in Region 2 became more efficient in the period from 2000 to 2014 than they had been in the period from 1970 to 2000, but those of several countries in this region did not.
D) national governments of countries in Region 1 and in Region 2 generally became more efficient in the period from 2000 to 2014 than they had been in the period from 1970 to 2000, but at different rates.
(A) Correct – The data suggest that GDP per capita accounted for less of ULE in Region 1 over time, implying a decline in government efficiency, which aligns with Mahtta et al.'s proposal.
(B) Incorrect – The graph does not provide information about the relative economic growth rates of the two regions, and Mahtta et al.'s proposal would indicate a decline, not an increase, in Region 1's efficiency.
(C) Incorrect – Neither the text nor the graph provides details about differences in efficiency among different governments within Region 2.
(D) Incorrect – The data suggest that while Region 2’s governments became more efficient, Region 1’s governments became less efficient, contradicting the statement that both regions experienced efficiency gains.
Question 16
A student is researching the Chinese government’s 1992 shift to a market economy that emphasizes trade liberalization. One means of trade liberalization involves expanding from ordinary imports into an emphasis on processing imports, which have two types: processing with assembly (in which a firm obtains raw materials from a foreign trading partner without payment and sells the final goods to that partner, charging for assembly) and processing with inputs (in which a firm expends capital to buy raw materials from a trading partner, processes them into final goods, and sells those goods to whichever trading partner it chooses). The student asserts that while initial efforts at trade liberalization were shaped by Chinese firms’ limited capital, this situation resolved during the 2000s.
Which choice best describes data from the graph that support the student’s assertion?
A) Processing imports with inputs were greater than both ordinary imports and processing imports with assembly in 2006.
B) From 2000 to 2006, processing imports with inputs rose much more sharply than processing imports with assembly did.
C) From 2000 to 2006, neither processing imports with inputs nor processing imports with assembly were greater than ordinary imports.
D) Processing imports with assembly were greater in 2006 than processing imports with inputs in 2000.
(A) Incorrect – The graph indicates that ordinary imports were greater than both types of processing imports in 2006, contradicting the claim that processing imports with inputs were the highest.
(B) Correct – The data show a sharp rise in processing imports with inputs, suggesting that firms gained more capital over time, aligning with the student’s assertion.
(C) Incorrect – While true, this observation does not directly support the student’s assertion about how limited capital was resolved during the 2000s.
(D) Incorrect – Comparing processing imports with assembly in 2006 to processing imports with inputs in 2000 does not highlight the trend that firms overcame limited capital over time.
Question 17
A student is researching a bus system in a large county where surface temperatures vary by area and are hot in the summer. The student claims that all areas of the county should have more bus stops with shaded shelter, noting that the highest percentage of bus stops with shaded shelter for any area is only _______.
Which choice most effectively uses data from the table to complete the student’s claim?
A) 50%
B) 15%
C) 90%
D) 29%
(A) Incorrect – The table does not include 50% as a percentage of bus stops with shaded shelter; the highest percentage is 29%.
(B) Incorrect – The table indicates that 15% is the lowest value for shaded shelters, not the highest.
(C) Incorrect – The table does not include 90% as a percentage of shaded shelters; the highest percentage is 29%.
(D) Correct – 29% is the highest percentage in the table, making this the best choice.
Question 18
In terms of area and population, the three smallest Arabian Peninsula countries are Bahrain, Qatar, and Kuwait.
According to the table, what is the total area of Bahrain?
A) 4,268,873 square miles
B) 4,471 square miles
C) 304 square miles
D) 6,880 square miles
(A) Incorrect – 4,268,873 is the population of Kuwait, not the total area of Bahrain.
(B) Incorrect – 4,471 square miles is the total area of Qatar, not of Bahrain.
(C) Correct – The table lists 304 square miles as the total area of Bahrain.
(D) Incorrect – 6,880 square miles is the total area of Kuwait, not of Bahrain.
Question 19
Approximate Rates of Speech and Information Conveyed for Five Languages
| Language | Rate of speech (syllables per second) | Rate of information conveyed (bits per second) |
| Serbian | 7.2 | 39.1 |
| Spanish | 7.7 | 42.0 |
| Vietnamese | 5.3 | 42.5 |
| Thai | 4.7 | 33.8 |
| Hungarian | 5.9 | 34.6 |
A group of researchers working in Europe, Asia, and Oceania conducted a study to determine how quickly different Eurasian languages are typically spoken (in syllables per second) and how much information they can effectively convey (in bits per second). They found that, although languages vary widely in the speed at which they are spoken, the amount of information languages can effectively convey tends to vary much less. Thus, they claim that two languages with very different spoken rates can nonetheless convey the same amount of information in a given amount of time.
Which choice best describes data from the table that supports the researchers' claim?
A) Among the five languages in the table, Thai and Hungarian have the lowest rates of speech and the lowest rates of information conveyed.
B) Vietnamese conveys information at approximately the same rate as Spanish, despite being spoken at a slower rate.
C) Among the five languages in the table, the language that is spoken the fastest is also the language that conveys information the fastest.
D) Serbian and Spanish are spoken at approximately the same rate, but Serbian conveys information faster than Spanish does.
Choice B is the best answer because it provides the most direct support from the table for the claim that two languages can convey similar amounts of information even if they’re spoken at different rates. The table shows the approximate rates at which five languages convey information. Vietnamese is spoken at around 5.3 syllables per second, whereas Spanish is spoken at around 7.7 syllables per second, but the two languages convey information at very similar rates: Vietnamese at a rate of around 42.5 bits per second and Spanish at a rate of around 42.0 bits per second. Thus, the description of Vietnamese conveying information at around the same rate that Spanish does, despite being spoken more slowly, supports the claim in the text that languages can convey the same amount of information even if spoken at different rates.
Choice A is incorrect because it’s not true that Thai and Hungarian have the lowest rates of speech of the five languages shown. According to the table, Hungarian is spoken at around 5.9 syllables per second, which is faster than Vietnamese (5.3 syllables per second). Additionally, even if this statement were true, the assertion that two languages are spoken the slowest and convey information the slowest wouldn’t support the claim that languages can convey the same amount of information even if they’re spoken at different rates.
Choice C is incorrect because it isn’t true that the fastest-spoken language (Spanish, at 7.7 syllables per second) also conveys information the fastest: Spanish conveys information at 42.0 bits per second, which is slower than the 42.5 bits-per-second rate at which Vietnamese conveys information. Additionally, even if this statement were true, the assertion that the language spoken the fastest also conveys information the fastest has no bearing on the claim that languages can convey the same amount of information even if they’re spoken at different rates.
Choice D is incorrect because it’s not true that Serbian conveys information faster than Spanish does. According to the table, Serbian conveys information at a rate of around 39.1 bits per second, which is slower than the 42.0 bits-per-second rate at which Spanish conveys information.
Question 20
To investigate the effect of lizard predation on spider populations, a student in a biology class placed spiders in two enclosures, one with lizards and one without, and tracked the number of spiders in the enclosures for 30 days. The student concluded that the reduction in the spider population count in the enclosure with lizards by day 30 was entirely attributable to the presence of the lizards.
Which choice best describes data from the graph that weakens the student’s conclusion?
A) The spider population count was the same in both enclosures on day 1.
B) The spider population count also substantially declined by day 30 in the enclosure without lizards.
C) The largest decline in spider population count in the enclosure with lizards occurred from day 1 to day 10.
D) The spider population count on day 30 was lower in the enclosure with lizards than in the enclosure without lizards.
Choice B is the best answer because it describes data from the graph that weakens the student’s conclusion about the reduction in the spider population in the enclosure with lizards. The graph shows that the enclosure with lizards and the enclosure without lizards each began with about 85 spiders, and that the number of spiders in each enclosure fell over the 30 days of the study. The student's claim is that the reduction in spiders in the enclosure with lizards was "entirely attributable to the presence of the lizards," meaning that the spider population wouldn't have declined except for the presence of the lizards. This claim is weakened, however, by the fact that the enclosure without the lizards also saw a substantial reduction in the number of spiders. Since the number of spiders fell in the enclosure without lizards as well as in the enclosure with lizards, there must be some other factor than just the presence of the lizards that contributed to the reduction in the spider population.
Choice A is incorrect because the fact that the two enclosures started with the same number of spiders is irrelevant to the claim that the reduction in spider population by day 30 in the enclosure with lizards can be entirely attributed to the lizards.
Choice C is incorrect because the fact that the spider population in the enclosure with lizards fell more between days 1 and 10 than in other periods has nothing to do with the student’s claim that the reduction in spiders in that enclosure by day 30 can be entirely attributed to the lizards.
Choice D is incorrect. Although it’s true that on day 30 the spider population was lower in the enclosure with lizards than in the enclosure without lizards, this fact doesn’t weaken the student’s claim that the reduction in the spider population in the enclosure with lizards can be entirely attributed to the lizards. Indeed, the lower spider population in the enclosure with lizards suggests that the lizards are contributing to the reduction in the spider population, though the fact that the spider population also fell substantially in the other enclosure means that the lizards aren’t the only cause of the reduction.
Question 21
Estimates of Tyrannosaurid Bite Force
| Study | Year | Estimation method | Approximate bite force (newtons) |
| Cost et al. | 2019 | muscular and skeletal modeling | 35,000-63,000 |
| Gignac and Erickson | 2017 | tooth-bone interaction analysis | 8,000-34,000 |
| Meers | 2002 | body-mass scaling | 183,000-235,000 |
| Bates and Falkingham | 2012 | muscular and skeletal modeling | 35,000-57,000 |
The largest tyrannosaurs—the family of carnivorous dinosaurs that includes Tarbosaurus, Albertosaurus, and, most famously, Tyrannosaurus rex—are thought to have had the strongest bites of any land animals in Earth’s history. Determining the bite force of extinct animals can be difficult, however, and paleontologists Paul Barrett and Emily Rayfield have suggested that an estimate of dinosaur bite force may be significantly influenced by the methodology used in generating that estimate.
Which choice best describes data from the table that supports Barrett and Rayfield’s suggestion?
A) The study by Meers used body-mass scaling and produced the lowest estimated maximum bite force, while the study by Cost et al. used muscular and skeletal modeling and produced the highest estimated maximum.
B) In their study, Gignac and Erickson used tooth-bone interaction analysis to produce an estimated bite force range with a minimum of 8,000 newtons and a maximum of 34,000 newtons.
C) The bite force estimates produced by Bates and Falkingham and by Cost et al. were similar to each other, while the estimates produced by Meers and by Gignac and Erickson each differed substantially from any other estimate.
D) The estimated maximum bite force produced by Cost et al. exceeded the estimated maximum produced by Bates and Falkingham, even though both groups of researchers used the same method to generate their estimates.
Choice C is the best answer because it accurately describes data from the table that supports Barrett and Rayfield’s suggestion about bite force estimates. According to the text, Barrett and Rayfield believe that estimates of dinosaur bite force may be strongly influenced by the methods used to produce them—that is, that different methods may produce significantly different results. The table shows that the studies by Bates and Falkingham and by Cost et al. used similar estimation methods and produced similar estimates of maximum bite force (35,000–57,000 newtons and 35,000–63,000 newtons, respectively). The study by Meers, however, used body-mass scaling and produced a much higher bite force estimate (183,000–235,000 newtons), while the study by Gignac and Erickson used tooth-bone interaction analysis and produced a much lower bite force estimate (8,000–34,000 newtons). The fact that one method produced extreme estimates in two different studies and that two different methods used in other studies produced similarly distant estimates supports the idea that dinosaur bite force estimates are significantly influenced by the methodology used to produce them.
Choice A is incorrect because it inaccurately describes data from the table. The table does show that Barrett and Rayfield’s suggested different estimation methodologies may produce significantly different estimates of dinosaur bite force, which would support Barrett and Rayfield’s suggestion that different methodologies may produce significantly different estimates. However, the table doesn’t show that the study by Meers produced the lowest estimated maximum bite force while the study by Cost et al. produced the highest. In fact, the study by Meers estimated a maximum bite force of approximately 235,000 newtons, which is the highest of all the estimated maximums.
Choice B is incorrect. Although the data from Gignac and Erickson’s study is accurately described, a single bit of findings from one study using only one methodology can’t show that different methodologies may produce significantly different dinosaur bite force estimates, as Barrett and Rayfield suggest.
Choice D is incorrect because the table shows that the maximum bite force estimated by Cost et al. is relatively small; in fact, both teams estimated a minimum bite force of approximately 35,000 newtons and a maximum bite force close to approximately 60,000 newtons. Because these findings demonstrate that a single methodology (muscular and skeletal modeling) produced similar overall results in two studies, the findings don’t support Barrett and Rayfield’s suggestion that different methodologies may produce significantly different dinosaur bite force estimates.
Question 22
Maximum Height of Maple Trees When Fully Grown
| Tree type | Maximum height (feet) | Native to North America |
| Sugar maple | 75 | yes |
| Silver maple | 70 | yes |
| Red maple | 60 | yes |
| Japanese maple | 25 | no |
| Norway maple | 50 | no |
For a school project, a forestry student needs to recommend a maple tree that is native to North America and won’t grow more than 60 feet in height. Based on the characteristics of five common maple trees, she has decided to select a ______.
Which choice most effectively uses data from the table to complete the text?
A) Silver maple
B) Sugar maple
C) Red maple
D) Norway maple
Choice C is the best answer because it most effectively uses data from the table to complete the statement about the forestry student's project. The table shows five types of maple trees, each tree's maximum height, and whether each tree is native to North America. The text indicates that the student needs to recommend a maple tree that's native to North America and won't reach a height greater than 60 feet. The red maple is the only tree listed in the table that meets these criteria: its maximum height is 60 feet—meaning that it won't grow higher than 60 feet—and it's native to North America.
Choice A is incorrect because the text states that the student needs to recommend a tree that's native to North America and won't grow higher than 60 feet, but the table shows that the maximum height of the silver maple is 70 feet.
Choice B is incorrect because the text states that the student needs to recommend a tree that's native to North America and won't grow higher than 60 feet, but the table shows that the maximum height of the sugar maple is 75 feet.
Choice D is incorrect because the text states that the student needs to recommend a tree that's native to North America and won't grow higher than 60 feet, but the table shows that the Norway maple isn’t native to North America.
Question 23
Characteristics of Five Recently Discovered Gas Exoplanets
| Exoplanet designation | Mass (Jupiters) | Radius (Jupiters) | Orbital period (days) | Distance from the Sun (parsecs) |
| TOI-640 b | 0.88 | 1.771 | 5.003 | 340 |
| TOI-1601 b | 0.99 | 1.239 | 5.331 | 336 |
| TOI-628 b | 6.33 | 1.060 | 3.409 | 178 |
| TOI-1478 b | 0.85 | 1.060 | 10.180 | 153 |
| TOI-1333 b | 2.37 | 1.396 | 4.720 | 200 |
“Hot Jupiters” are gas planets that have a mass of at least 0.25 Jupiters (meaning that their mass is at least 25% of that of Jupiter) and an orbital period of less than 10 days (meaning that they complete one orbit around their star in less than 10 days), while “warm Jupiters” are gas planets that meet the same mass criterion but have orbital periods of more than 10 days. In 2021, Michigan State University astronomer Joseph Rodriguez and colleagues announced the discovery of five new gas exoplanets and asserted that four are hot Jupiters and one is a warm Jupiter.
Which choice best describes data from the table that support Rodriguez and colleagues' assertion?
A) None of the planets have an orbital period of more than 10 days, and TOI-628 b has a mass of 6.33 Jupiters.
B) TOI-1478 b has an orbital period of 153 days, and the masses of all the planets range from 0.85 to 6.33 Jupiters.
C) All the planets have a radius between 1.060 and 1.771 Jupiters, and TOI-1333 b has an orbital period of more than 10 days.
D) Each of the planets has a mass greater than 0.25 Jupiters, and all except for TOI-1478 have an orbital period of less than 10 days.
Choice D is the best answer because it accurately describes data from the table that support Rodriguez and colleagues’ assertion about the classifications of the five new gas exoplanets. The text describes two categories of gas planets: hot Jupiters, which have a mass of at least 0.25 Jupiters and an orbital period of less than 10 days, and warm Jupiters, which have the same mass characteristic but have orbital periods of more than 10 days. According to the table, four of the gas exoplanets discovered by Rodriguez and colleagues have a mass of at least 0.25 Jupiters and an orbital period of less than 10 days, while one of the planets has a mass of at least 0.25 Jupiters and an orbital period of more than 10 days. These data therefore support Rodriguez and colleagues’ assertion that four of the new exoplanets are hot Jupiters and one is a warm Jupiter.
Choice A is incorrect because it doesn’t accurately describe the data from the table. Although the table shows that TOI-628 b has a mass equivalent to 6.33 Jupiters, the table also shows that one of the planets—TOI-1478 b—does indeed have an orbital period of more than 10 days.
Choice B is incorrect because it doesn’t accurately describe the data from the table. Although the table does show that the masses of the five planets range from 0.85 to 6.39 Jupiters, the table also shows that TOI-1478 b has an orbital period of 10.180 days, not 10 days.
Choice C is incorrect. According to the table, TOI-1233 b has an orbital period of only 4.720 days, not more than 10 days. Additionally, although the table does show that all the planets have a radius between 1.060 and 1.771 Jupiters, the text indicates that a planet may be classified as a hot Jupiter or a warm Jupiter based on its mass and orbital period, not on its radius, making the information about the range of the five planets’ radius values irrelevant.
Question 24
Economists Kerwin Kofi Charles and Melvin Stephens Jr. investigated a variety of factors that influence voter turnout in the United States. Using survey data that revealed whether respondents voted in national elections and how knowledgeable respondents are about politics, Charles and Stephens claim that the likelihood of voting is driven in part by potential voters' confidence in their assessments of candidates—essentially, the more informed voters are about politics, the more confident they are at evaluating whether candidates share their views, and thus the more likely they are to vote.
Which choice best describes data in the graph that supports Charles and Stephens’s claim?
A) At each point on the political orientation scale, high-information voters were more likely than low-information voters to vote.
B) Only low-information voters who identify as independents had a voting probability below 50%.
C) The closer that low-information voters are to the ends of the political orientation scale, the more likely they were to vote.
D) High-information voters were more likely to identify as strong Democrats or strong Republicans than low-information voters were.
Choice A is the best answer because it uses data from the graph to effectively support Charles and Stephens’ claim about how level of information affects voters. The graph shows the probability of voting for both high- and low-information voters in seven categories of political orientation. Charles and Stephens claim that “the more informed voters are about politics...the more likely they are to vote.” This statement correctly asserts that the graph shows a higher probability of voting for high-information voters than for low-information voters at each of the seven political orientations. Thus, this statement accurately cites data from the graph that supports Charles and Stephens' claim about how the level of information affects voters.
Choice B is incorrect. Although this statement is correct that the only probability in the graph below 50% is for low-information voters categorized as independent (orientation 4), the claim in question is about the relative likelihood that low- and high-information voters will vote, and without some reference to high-information voters, this statement cannot help support such a comparison.
Choice C is incorrect. Although this statement is correct that the highest probabilities of voting for low-information voters are at the ends of the orientation scale (1 and 7), the claim in question is about the relative likelihood that low- and high-information voters will vote, and without some reference to high-information voters, this statement cannot help support such a comparison.
Choice D is incorrect because the graph does not give any information about how many people are represented in any of the categories, so this statement is not based on data from the graph. Furthermore, even if we did have this information, the claim is about how level of information affects voters’ probability of voting, not whether they’re likely to strongly identify with a particular party.
Question 25
Organic farming is a method of growing food that tries to reduce environmental harm by using natural forms of pest control and avoiding fertilizers made with synthetic materials. Organic farms are still a small fraction of the total farms in the United States, but they have been becoming more popular. According to the US Department of Agriculture, in 2016, California had between 2,600 and 2,800 organic farms and _________.
Which choice most effectively uses data from the graph to complete the text?
A) Washington had between 600 and 800 organic farms.
B) New York had fewer than 800 organic farms.
C) Wisconsin and Iowa each had between 1,200 and 1,400 organic farms.
D) Pennsylvania had more than 1,200 organic farms.
Choice A is the best answer because it uses data from the graph to accurately complete the text. The graph shows the number of organic farms located in each of six U.S. states in 2016: between 2,600 and 2,800 in California; between 1,200 and 1,400 in Wisconsin; between 1,000 and 1,200 in New York; approximately 800 in Pennsylvania; and between 600 and 800 in both Iowa and Washington. The last sentence of the text provides information about the number of organic farms in 2016, first describing the number in California. The best completion of the sentence is the choice that accurately describes the number of organic farms in 2016 in another state, which the assertion that Washington had between 600 and 800 organic farms provides.
Choice B is incorrect because it doesn’t accurately reflect the data from the graph. The graph indicates that there were between 1,000 and 1,200 organic farms in New York, not fewer than 800 organic farms.
Choice C is incorrect because it doesn’t accurately reflect the data from the graph. While the graph indicates that there were between 1,200 and 1,400 organic farms in Wisconsin in 2016, there were only between 600 and 800 in Iowa.
Choice D is incorrect because it doesn’t accurately reflect the data from the graph. The graph indicates that in 2016 there were approximately 800 organic farms in Pennsylvania, not more than 1,200.
Question 26
Ablation Rates for Three Elements in Cosmic Dust, by Dust Source
| Element | SPC | AST | HTC | OCC |
| iron | 20% | 28% | 90% | 98% |
| potassium | 44% | 74% | 97% | 100% |
| sodium | 45% | 75% | 99% | 100% |
Earth’s atmosphere is bombarded by cosmic dust originating from several sources: short-period comets (SPCs), particles from the asteroid belt (ASTs), Halley-type comets (HTCs), and Oort cloud comets (OCCs). Some of the dust’s material vaporizes in the atmosphere in a process called ablation, and the faster the particles move, the higher the rate of ablation. Astrophysicist Juan Diego Carrillo-Sánchez led a team that calculated average ablation rates for elements in the dust (such as iron and potassium) and showed that material in slower-moving SPC or AST dust has a lower rate than the same material in faster-moving HTC or OCC dust. For example, whereas the average ablation rate for iron from AST dust is 28%, the average rate for __________.
Which choice most effectively uses data from the table to complete the example?
A) iron from SPC dust is 20%.
B) sodium from OCC dust is 100%.
C) iron from HTC dust is 90%.
D) sodium from AST dust is 75%.
Choice C is the best answer because it most effectively completes the example regarding the ablation rate of iron. The table shows the ablation rates for three elements—iron, potassium, and sodium—found in cosmic dust that comes from one of four sources. The text says that the ablation rate for a given element in slower-moving SPC or AST dust was lower than the ablation rate for that same element in faster-moving HTC or OCC dust. The text then presents the first part of an example of this pattern, describing an ablation rate of 28% for iron in AST dust. The information that iron from HTC dust had an ablation rate of 90% is therefore the most effective way to complete this example—the comparison of a relatively low ablation rate for iron in slower-moving AST dust with a relatively high ablation rate for iron in faster-moving HTC dust illustrates the tendency of ablation rates for a given element to be lower in slower-moving dust than in faster-moving dust.
Choice A is incorrect because the text indicates that SPC dust, like AST dust, moves relatively slowly; a comparison of the ablation rates of iron from two slower-moving dust sources could not be an example of the difference between ablation rates in slower-moving dust and faster-moving dust, which is the pattern that the example is supposed to illustrate.
Choice B is incorrect because the example in the text is supposed to illustrate the difference in the ablation rates of the same element from slower-moving dust and faster-moving dust, and the first part of the example provides data about the ablation rate of iron, which means the second part of the example must also be about the ablation rate of iron, not the ablation rate of sodium.
Choice D is incorrect because the example in the text is supposed to illustrate the difference in the ablation rates of the same element from slower-moving dust and faster-moving dust, and the first part of the example provides data about the ablation rate of iron, which means the second part of the example must also be about the ablation rate of iron, not the ablation rate of sodium. Additionally, any ablation rate from AST dust would be ineffective in this example since AST dust is referenced in the first part of the example and thus additional data focused on AST dust would not illustrate a variation across dust types.
Question 27
Effects of Mycorrhizal on 3 Plant Species
| Plant species | Mycorrhizal host | Average mass of plants grown in soil containing mycorrhizal fungi (in grams) | Average mass of plants grown in soil treated to kill fungi (in grams) |
| Corn | yes | 15.1 | 3.8 |
| Marigold | yes | 10.2 | 2.4 |
| Broccoli | no | 7.5 | 7 |
Mycorrhizal fungi in soil benefits many plants, substantially increasing the mass of some. A student conducted an experiment to illustrate this effect. The student chose three plant species for the experiment, including two that are mycorrhizal hosts (species known to benefit from mycorrhizal fungi) and one nonmycorrhizal species (a species that doesn’t benefit from and may even be harmed by mycorrhizal fungi). The student then grew several plants from each species both in soil containing mycorrhizal fungi and in soil that had been treated to kill mycorrhizal and other fungi. After several weeks, the student measured the plants’ average mass and was surprised to discover ________.
Which choice most effectively uses data from the table to complete the statement?
A) Broccoli grown in soil containing mycorrhizal fungi had a slightly higher average mass than broccoli grown in soil that had been treated to kill fungi.
B) Corn grown in soil containing mycorrhizal fungi had a higher average mass than broccoli grown in soil containing mycorrhizal fungi.
C) Marigolds grown in soil containing mycorrhizal fungi had a much higher average mass than marigolds grown in soil that had been treated to kill fungi.
D) Corn had the highest average mass of all three species grown in soil that had been treated to kill fungi, while marigolds had the lowest.
Choice A is the best answer because it most effectively uses data from the table to complete the statement. The text explains that mycorrhizal hosts are plants that benefit from the presence of mycorrhizal fungi in the soil and that some such plants produce more mass when grown in the presence of these fungi, while for nonmycorrhizal species the fungi either have no effect or may be harmful. The experiment included two mycorrhizal hosts (corn and marigold) and one nonmycorrhizal species (broccoli). Given the claim in the text that nonmycorrhizal species will see either no difference or a decrease in mass when exposed to mycorrhizal fungi, the student would likely have been surprised by the higher average mass for broccoli grown in the presence of the fungi than the broccoli grown in the soil treated to kill fungi.
Choice B is incorrect. Although this choice accurately describes the corn data from the table, the fact that the mycorrhizal host corn is more massive in the presence of the fungi likely fits with what the student expected and would therefore not be surprising.
Choice C is incorrect. Although this choice accurately describes the marigold data from the table, the fact that the mycorrhizal host marigold is more massive in the presence of the fungi is likely what the student expected and thus would not be surprising.
Choice D is incorrect because it does not accurately represent the data in the table—when grown in soil treated to kill fungi, corn had an average mass of 3.8g while broccoli had an average mass of 7g—and because making comparisons among the plants in the no-fungi condition, by itself, does not provide a basis to compare the average mass of mycorrhizal hosts and nonmycorrhizal species grown in the presence of the fungi with those grown in the soil treated to kill fungi.
Question 28
High levels of public uncertainty about which economic policies a country will adopt can make planning difficult for businesses, but measures of such uncertainty have not tended to be very detailed. Recently, however, economist Sandile Hlatshwayo analyzed trends in news reports to derive measures not only for general economic policy uncertainty but also for uncertainty related to specific areas of economic policy, like tax or trade policy. One revelation of her work is that a general measure may not fully reflect uncertainty about specific areas of policy, as in the case of the United Kingdom, where general economic policy uncertainty ________.
Which choice most effectively uses data from the graph to illustrate the claim?
A) aligned closely with uncertainty about tax and public spending policy in 2005 but differed from uncertainty about tax and public spending policy by a large amount in 2009.
B) was substantially lower than uncertainty about tax and public spending policy each year from 2005 to 2010.
C) reached its highest level between 2005 and 2010 in the same year that uncertainty about trade policy and tax and public spending policy reached their lowest levels.
D) was substantially lower than uncertainty about trade policy in 2005 and substantially higher than uncertainty about trade policy in 2010.
Choice D is the best answer because it uses data from the graph to effectively illustrate the text's claim about general economic policy uncertainty in the United Kingdom. The graph presents values for economic policy uncertainty in tax and public spending policy, trade policy, and general economic policy in the UK from 2005 to 2010. The graph shows that in 2005, the value for general economic policy uncertainty (approximately 90) was substantially lower than the value for uncertainty about trade policy specifically (approximately 120). It also shows that in 2010, the value for general economic policy uncertainty (approximately 120) was substantially higher than the value for uncertainty about trade policy (approximately 70). The substantial differences between these values in 2005 and 2010 support the claim that a general measure may not fully reflect uncertainty about specific areas of policy.
Choice A is incorrect because the graph shows that the level of general economic policy uncertainty was similar to the level of uncertainty about tax and public spending policy in both 2005 (with values of approximately 90 and 100, respectively) and 2009 (with values of approximately 80 and 75, respectively).
Choice B is incorrect because the graph shows that general economic policy uncertainty was higher than uncertainty about tax and public spending policy in 2006, 2007, and 2009, not that it was lower each year from 2005 to 2010.
Choice C is incorrect because the graph shows that general economic policy uncertainty reached its highest level in 2010, which was when uncertainty about tax and public spending policy also reached its highest level, not its lowest level.
Question 29
Partial List of Candidate Species for De-extinction
| Common name | Scientific name | Became extinct |
| Huia | Heteralocha acutirostris | 1907 |
| Caribbean monk seal | Monachus tropicalis | 1952 |
| Passenger pigeon | Ectopistes migratorius | 1914 |
| Saber-toothed cat | Smilodon | 11,000 years before present |
| Woolly mammoth | Mammuthus primigenius | 6,400 years before present |
The passage of time is among the many obstacles faced by scientists who are pursuing de-extinction efforts—that is, efforts to use breeding or a mixture of cloning and genetic engineering to bring back extinct species. Specifically, researchers are concerned that the longer a species has been extinct, the less likely it is that a suitable habitat still exists for that species. Among candidate species for de-extinction, this problem would be especially concerning for the ______.
Which choice most effectively uses data from the table to complete the statement?
A) passenger pigeon (Ectopistes migratorius), which became extinct only a few years after the huia (Heteralocha acutirostris).
B) saber-toothed cat (Smilodon), which became extinct 11,000 years ago.
C) woolly mammoth (Mammuthus primigenius), which became extinct several thousand years before the saber-toothed cat (Smilodon).
D) Caribbean monk seal (Monachus tropicalis), which became extinct in 1952.
Choice B is the best answer because it uses data from the table to complete the statement regarding a species for which the problem of finding a suitable habitat would be especially concerning. For each candidate species, the table lists its common name, scientific name, and when the species became extinct. The text explains that scientists pursuing de-extinction for the candidate species also consider the length of time that has passed since the species’ extinction, noting that the longer the animal has been extinct, the less likely it is that a suitable habitat would exist for the species today. The possibility of not having a suitable habitat would be especially concerning for the candidate species for which the most time has passed since its extinction. According to the table, this species would be the saber-toothed cat, which became extinct 11,000 years before present.
Choice A is incorrect because it compares the time since the extinction of the passenger pigeon to the time since the extinction of the huia instead of citing the species listed in the table that has been extinct the longest (the saber-toothed cat). The text indicates that the longer a species has been extinct, the lower the chances are that a suitable habitat exists for it today. Neither the table nor the text supports the claim that the passenger pigeon is especially vulnerable to this problem.
Choice C is incorrect because the text states that the longer a species has been extinct, the less likely it is that there would be a suitable habitat available for the species today. So, the problem would be especially concerning for the woolly mammoth did not the other way around.
Choice D is incorrect because it states that the longer a species has been extinct, the lower the chances are that a suitable habitat would be available for that species today. According to the table, the Caribbean monk seal became extinct in 1952, which is the most recent extinction listed for a candidate species in the table.
Question 30
The population of the coral Lophelia pertusa declined significantly around 9,000 years ago in the Alboran Sea and around 11,000 years ago near the Mauritanian coast. Using the ratio of manganese to calcium, which inversely correlates with ocean oxygenation levels, marine scientist Rodrigo da Costa Portilho-Ramos and colleagues evaluated whether oxygenation played a role in the declines of L. pertusa. The researchers concluded that oxygenation may have been important in the Alboran Sea but not near the Mauritanian coast, since ________.
Which choice most effectively uses data from the graph to complete the statement?
A) a substantial increase in oxygenation in the Alboran Sea corresponded with the local decline in L. pertusa, but the opposite relationship between oxygenation and L. pertusa was found near the Mauritanian coast.
B) L. pertusa declined in the Alboran Sea during a period of substantial local decline in oxygenation, but L. pertusa declined near the Mauritanian coast during a period of little local change in oxygenation.
C) oxygenation in the Alboran Sea was higher before the decline in L. pertusa than after the decline, whereas oxygenation near the Mauritanian coast was relatively low both before and after the decline in L. pertusa.
D) oxygenation in the Alboran Sea tended to be substantially higher than oxygenation near the Mauritanian coast during the period studied.
Choice B is the best answer because it effectively uses data from the graph to complete the statement about Rodrigo da Costa Portilho-Ramos and his colleague's conclusions. The graph shows that the ratio of manganese to calcium in the Alboran Sea decreased significantly during the period between 9,000 and 10,000 years ago, which corresponds to a significant decline in Lophelia pertusa populations. At the same time, oxygenation levels in the Alboran Sea were low, suggesting that oxygenation played a key role in the decline. In contrast, the ratio of manganese to calcium near the Mauritanian coast remained relatively stable, indicating less variation in oxygenation. According to the text, the local changes in oxygenation near the Mauritanian coast did not play a significant role in the decline of L. pertusa, suggesting that oxygenation levels were not a key factor there.
Choice A is incorrect because the text does not claim that the opposite relationship between oxygenation and L. pertusa was found near the Mauritanian coast. The graph shows that oxygenation was relatively stable near the Mauritanian coast, not that there was an opposite trend compared to the Alboran Sea.
Choice C is incorrect because although oxygenation in the Alboran Sea was lower after the decline in L. pertusa, the graph does not suggest that oxygenation near the Mauritanian coast was consistently low before and after the decline. The text and the graph both show that oxygenation near the Mauritanian coast was relatively stable, not unusually low.
Choice D is incorrect because it suggests that oxygenation in the Alboran Sea was consistently higher than near the Mauritanian coast during the studied period, which is not supported by the graph. The oxygenation levels were highly variable in the Alboran Sea but relatively stable near the Mauritanian coast.
Question 31
A student is researching the trends in the topics submitted to a national science fair for high school students. The graph shows the number of submissions by topic that were made each year. Based on the data in the graph, the student claims that there were more medicine and health research topics submitted in 2019 than in any other year.
Which choice most effectively uses data from the graph to support the underlined claim?
A) In 2016, the number of cellular and molecular biology topic submissions was the same as the number of animal science topic submissions.
B) In 2019, there were more physics and space science topic submissions than there were medicine and health topic submissions.
C) The lowest number of animal science topic submissions during the period shown was approximately 95 in 2016.
D) The highest number of medicine and health topic submissions during the period shown is approximately 285 in 2019.
Choice D is the best answer because it effectively uses data from the graph to support the underlined claim that more medicine and health topics were submitted to a national science fair in 2019 than in any of the other years shown. This choice indicates that the approximately 285 medicine and health topics submitted in 2019 are more than the number of medicine and health submissions in any other year shown—a description that is supported by information in the graph, which shows that medicine and health topic submissions were below 250 in 2016, 2017, and 2018, but above 250 (approximately 285 submissions) in 2019.
Choice A is incorrect because it doesn’t support the underlined claim or accurately reflect the information in the graph. This choice refers to 2016 and discusses cellular and molecular biology and animal science, whereas the underlined claim refers to 2019 and discusses medicine and health. Moreover, the claim that in 2016 there were equal numbers of submissions in the cellular and molecular biology category and in the animal science category is contradicted by the graph, which shows approximately 200 submissions and 50 submissions, respectively, for those categories in 2016.
Choice B is incorrect because it doesn’t accurately reflect the information in the graph. This choice claims that in 2019, there were more physics and space submissions than there were medicine and health submissions, but the graph shows that there were approximately 100 space and science submissions that year and approximately 285 medicine and health submissions.
Choice C is incorrect because it doesn’t accurately reflect the information in the graph or support the underlined claim about medicine and health research topics. This choice claims that there were approximately 95 submissions for the animal science category in 2016, but the graph shows that the number was closer to 50 in 2016.
Question 32
Inés Ibáñez and colleagues studied a forest site in which some sugar maple trees receive periodic fertilization with nitrogen to mimic the broader trend of increasing anthropogenic nitrogen deposition in soil. Ibáñez and colleagues modeled the radial growth of the trees with and without nitrogen fertilization under three different climate scenarios (the current climate, moderate change, and extreme change). Although they found that climate change would negatively affect growth, they concluded that anthropogenic nitrogen deposition could more than offset that effect, provided that the change is moderate rather than extreme.
Which choice best describes data from the graph that supports Ibáñez and colleagues’ conclusion?
A) Growth with nitrogen under the current climate exceeded growth with nitrogen under moderate change, but the latter exceeded growth without nitrogen under extreme change.
B) Growth without nitrogen under the current climate exceeded growth with nitrogen under moderate change, but the latter exceeded growth without nitrogen under extreme change.
C) Growth with nitrogen under moderate change exceeded growth without nitrogen under moderate change, but the latter exceeded growth without nitrogen under extreme change.
D) Growth with nitrogen under moderate change exceeded growth without nitrogen under the current climate, but the latter exceeded growth with nitrogen under extreme change.
Choice D is the best answer because it describes data from the graph that supports Ibáñez and colleagues’ conclusion that increasing anthropogenic nitrogen deposition can compensate for the negative effect of climate change on tree growth if that change is moderate, but not if it’s extreme. The bar graph shows the growth of sugar maple trees with and without nitrogen fertilization under three different climate-change scenarios: current conditions, a moderate change, and an extreme change. According to the graph, radial growth without nitrogen fertilization is projected to be about 0.16 centimeters (cm) under current conditions, 0.15 cm under a moderate change, and 0.04 cm under an extreme change. The graph also shows that with nitrogen fertilization, growth is projected to be about 0.18 centimeters under a moderate change but only about 0.06 centimeters under an extreme change. Thus, the data in the graph support the researchers’ conclusion by showing greater growth for a moderate change using nitrogen fertilization than they do either under current conditions without nitrogen fertilization or under an extreme change with nitrogen fertilization.
Choice A is incorrect. Although it accurately represents the data in the graph, this fact pattern doesn’t support Ibáñez and colleagues’ conclusion that the decline in radial growth due to climate change will be partly offset by higher levels of atmospheric nitrogen, but only if change to the climate is moderate and not if it’s extreme. To support this would require comparing radial growth with nitrogen fertilization under current climate conditions to the growth with nitrogen fertilization under both moderate and extreme changes. This choice mentions only growth without nitrogen fertilization and conditions under current and moderate change, and growth with nitrogen fertilization under extreme change, which don’t provide a basis to determine whether higher nitrogen in the future will be able to offset reduced growth due to climate change.
Choice B is incorrect. Although it accurately represents the data in the graph, this fact pattern doesn’t support Ibáñez and colleagues’ conclusion that the decline in radial growth due to climate change will be partly offset by higher levels of atmospheric nitrogen, but only if change to the climate is moderate and not if it’s extreme. The support needed would compare radial growth under current climate conditions with nitrogen fertilization under both moderate and extreme changes. This choice mentions only growth without nitrogen fertilization and growth under current and moderate change, which don’t provide a basis to determine whether higher nitrogen in the future will be able to offset reduced growth due to climate change.
Choice C is incorrect. Although it accurately represents the data in the graph, this fact pattern doesn’t support Ibáñez and colleagues’ conclusion that the decline in radial growth due to climate change will be partly offset by higher levels of atmospheric nitrogen, but only if change to the climate is moderate and not if it’s extreme. The support needed would compare radial growth without adding nitrogen under current climate conditions to the growth with nitrogen fertilization under moderate and extreme changes. This choice mentions only the growth with and without nitrogen fertilization under moderate climate change and growth without nitrogen fertilization under extreme change, which don’t provide a basis to determine whether higher nitrogen in the future will be able to offset reduced growth due to climate change.
Question 33
Simulated Change in Annual Aquifer Input and Irrigation Output if
Precipitation Concentration Increases as Climate Models Predict
| Baseline concentration of annual precipitation | % change in water entering aquifers | % change in surface water used for irrigation | % change in groundwater used for irrigation |
| Precipitation is currently somewhat concentrated | 4.9 | 0.4 | 0.9 |
| Precipitation is currently evenly distributed | 11.0 | 9.0 | 7.9 |
Some climate models for the western United States predict that while total annual precipitation may remain unchanged from the present level, precipitation will become concentrated into fewer but more intense rain and snow events. University of Texas climate scientist Geeta Persad and her colleagues simulated how the amount of water entering aquifers and the amount being used for irrigation purposes would change if this were to occur. Persad and her colleagues concluded that the concentration of precipitation into fewer events would result in a higher number of dry days, triggering more irrigation, but that this change in irrigation output is highly sensitive to the baseline concentration of precipitation that currently exists in an area.
Which choice best describes data from the table that supports Persad and her colleagues’ conclusion?
A) If baseline precipitation is somewhat concentrated, the amount of water being used for irrigation will increase 0.4% for surface water and 0.9% for groundwater, whereas the amount of water entering aquifers will increase 11.0% if baseline precipitation is evenly distributed.
B) If baseline precipitation is somewhat concentrated, water use for irrigation will increase only slightly, whereas it will increase 9.0% for surface water and 7.9% for groundwater if baseline precipitation is evenly distributed.
C) If baseline precipitation is somewhat concentrated, the amount of water entering aquifers will increase 4.9%, while the amount being used for irrigation will increase 0.4% for surface water and 0.9% for groundwater.
D) If baseline precipitation is somewhat concentrated, water use for irrigation will decline by a small amount, whereas it will increase 11.0% for surface water and 9.0% for groundwater if baseline precipitation is evenly distributed.
Choice B is the best answer because it describes data from the table that supports Persad and her colleagues' conclusion. The text explains that, according to some climate models, precipitation in the western United States will become concentrated into fewer, more intense rain and snow events. According to the text, Persad and her colleagues concluded that more irrigation will consequently be needed, but that the change in irrigation output will be highly sensitive to, or greatly affected by, the baseline concentration of precipitation in an area. This conclusion is supported by data from the researchers’ simulations of changes in annual irrigation output in two different scenarios—one in which an area’s annual precipitation is already somewhat concentrated and one in which its annual precipitation is evenly distributed. The table shows that if baseline precipitation is somewhat concentrated, water use for irrigation will increase only slightly, whereas if baseline precipitation is evenly distributed, water use for irrigation will increase much more—0.9% for surface water and 7.9% for groundwater. This difference illustrates the researchers’ conclusion that the amount of additional water needed for irrigation will vary greatly depending on how concentrated or spread out the annual precipitation in an area already is.
Choice A is incorrect because it compares changes in the amount of water being used for irrigation to changes in the amount of water entering aquifers. Persad and her colleagues’ conclusion doesn’t focus on changes to the amount of water entering aquifers; rather, the researchers’ conclusion focuses on changes to irrigation output relative to how concentrated or spread out the annual precipitation in an area is.
Choice C is incorrect because it supports only part of Persad and her colleagues’ conclusion. According to the text, the researchers found that the concentration of precipitation into fewer events will trigger more irrigation, but that this change in irrigation output will be highly sensitive to, or greatly affected by, the baseline concentration of annual precipitation. The data in this choice supports the ideal, more irrigated area, but it doesn’t support the conclusion that the amount of water needed for irrigation will vary depending on how concentrated or spread out the annual precipitation is.
Choice D is incorrect because it compares changes in the amount of water being used for irrigation to changes in the amount of water entering aquifers. Persad and her colleagues’ conclusion doesn’t focus on changes to the amount of water entering aquifers; rather, the researchers’ conclusion focuses on changes to irrigation output relative to how concentrated or spread out the annual precipitation in an area is.
Question 34
Ablation Rates for Three Elements in Cosmic Dust, by Dust Source
| Element | SPC | AST | HTC | OCC |
| iron | 20% | 28% | 90% | 98% |
| potassium | 44% | 74% | 97% | 100% |
| sodium | 45% | 75% | 99% | 100% |
Earth's atmosphere is bombarded by cosmic dust originating from several sources: short-period comets (SPCs), particles from the asteroid belt (ASTs), Halley-type comets (HTCs), and Oort cloud comets (OCCs). Some of the dust's material vaporizes in the atmosphere in a process called ablation, and the faster the particles move, the higher the rate of ablation. Astrophysicist Juan Diego Carrillo-Sánchez led a team that calculated average ablation rates for elements in the dust (such as iron and potassium) and showed that material in slower-moving SPC or AST dust has a lower rate than the same material in faster-moving HTC or OCC dust. For example, whereas the average ablation rate for iron from AST dust is 28%, the average rate for __________.
Which choice most effectively uses data from the table to complete the example?
A) iron from SPC dust is 20%
B) sodium from OCC dust is 100%
C) iron from HTC dust is 90%
D) sodium from AST dust is 75%
Choice C is the best answer because it most effectively completes the example regarding the ablation rate of iron. The table shows the ablation rates for three elements—iron, potassium, and sodium—found in cosmic dust that comes from one of four sources. The text says that the ablation rate for a given element in slower-moving SPC or AST dust was lower than the ablation rate for that same element in faster-moving HTC or OCC dust. The text then presents the first part of an example of this pattern, describing an ablation rate of 28% for iron in AST dust. The information that iron from HTC dust had an ablation rate of 90% is therefore the most effective way to complete this example—the comparison of a relatively low ablation rate for iron in slower-moving AST dust with a relatively high ablation rate for iron in faster-moving HTC dust illustrates the tendency of ablation rates for a given element to be lower in slower-moving dust than in faster-moving dust.
Choice A is incorrect because the text indicates that SPC dust, like AST dust, moves relatively slowly; a comparison of the ablation rates of iron from two slower-moving dust sources could not be an example of the difference between ablation rates in slower-moving dust and faster-moving dust, which is the pattern that the example is supposed to illustrate.
Choice B is incorrect because the example in the text is supposed to illustrate the difference in the ablation rates of the same element from slower-moving dust and faster-moving dust, and the first part of the example provides data about the ablation rate of iron, which means the second part of the example must also be about the ablation rate of iron, not the ablation rate of sodium.
Choice D is incorrect because the example in the text is supposed to illustrate the difference in the ablation rates of the same element from slower-moving dust and faster-moving dust, and the first part of the example provides data about the ablation rate of iron, which means the second part of the example must also be about the ablation rate of iron, not the ablation rate of sodium. Additionally, any ablation rate from AST dust would be ineffective in this example since AST dust is referenced in the first part of the example and thus additional data focused on AST dust would not illustrate a variation across dust types.
Question 35
High levels of public uncertainty about which economic policies a country will adopt can make planning difficult for businesses, but measures of such uncertainty have not tended to be very detailed. Recently, however, economist Sandile Hlatshwayo analyzed trends in news reports to derive measures not only for general economic policy uncertainty but also for uncertainty related to specific areas of economic policy, like tax or trade policy. One revelation of her work is that a general measure may not fully reflect uncertainty about specific areas of policy, as in the case of the United Kingdom, where general economic policy uncertainty.
Which choice most effectively uses data from the graph to illustrate the claim?
A) aligned closely with uncertainty about tax and public spending policy in 2005 but differed from uncertainty about tax and public spending policy by a large amount in 2009.
B) was substantially lower than uncertainty about tax and public spending policy from 2005 to 2010.
C) reached its highest level between 2005 and 2010 in the same year that uncertainty about trade policy and tax and public spending policy reached their lowest levels.
D) was substantially lower than uncertainty about trade policy in 2005, but reached similar levels in 2009.
Choice D is the best answer because it uses data from the graph to effectively illustrate the text's claim about general economic policy uncertainty in the United Kingdom. The graph presents values for economic policy uncertainty in tax and public spending policy, trade policy, and general economic policy in the UK from 2005 to 2010. The graph shows that in 2005, the value for general economic policy uncertainty (approximately 90) was substantially lower than the value for uncertainty about trade policy specifically (approximately 160). It also shows that in 2010, the value for general economic policy uncertainty (approximately 120) was substantially higher than the value for uncertainty about trade policy (approximately 70). The substantial differences between these values in 2005 and 2010 support the claim that a general measure may not fully reflect uncertainty about specific areas of policy.
Choice A is incorrect because the graph shows that the level of general economic policy uncertainty was similar to the level of uncertainty about tax and public spending policy in both 2005 (with values of approximately 90 and 100, respectively) and 2009 (with values of approximately 80 and 75, respectively).
Choice B is incorrect because the graph shows that general economic policy uncertainty was higher than uncertainty about tax and public spending policy in 2006, 2007, and 2009, not that it was lower each year from 2005 to 2010.
Choice C is incorrect because the graph shows that general economic policy uncertainty reached its highest level in 2010, which was when uncertainty about tax and public spending policy also reached its highest level, not its lowest level.
Question 36
Average Number and Duration of Torpor Bouts and Arousal Episodes for Alaska Marmots
and Arctic Ground Squirrels, 2008-2011
| Feature | Alaska marmots | Arctic ground squirrels |
| torpor bouts | 12 | 10.5 |
| duration per bout | 13.81 days | 16.77 days |
| arousal episodes | 11 | 9.5 |
| duration per episode | 21.2 hours | 14.2 hours |
When hibernating, Alaska marmots and Arctic ground squirrels enter a state called torpor, which minimizes the energy their bodies need to function. Often, a hibernating animal will temporarily come out of torpor (called an arousal episode) and its metabolic rate will rise, burning more of the precious energy the animal needs to survive the winter. Alaska marmots hibernate in groups and therefore burn less energy keeping warm during these episodes than they would if they were alone. A researcher hypothesized that because Arctic ground squirrels hibernate alone, they would likely exhibit longer bouts of torpor and shorter arousal episodes than Alaska marmots.
Which choice best describes data from the table that supports the researcher’s hypothesis?
A) The Alaska marmots’ arousal episodes lasted for days, while the Arctic ground squirrels’ arousal episodes lasted less than a day.
B) The Alaska marmots and the Arctic ground squirrels both maintained torpor for several consecutive days per bout, on average.
C) The Alaska marmots had shorter torpor bouts and longer arousal episodes than the Arctic ground squirrels did.
D) The Alaska marmots had more torpor bouts than arousal episodes, but their arousal episodes were much shorter than their torpor bouts.
Choice C is the best answer because it describes data from the table that support the researcher’s hypothesis. According to the text, the researcher hypothesized that Arctic ground squirrels would exhibit longer torpor bouts and shorter arousal episodes than Alaska marmots do—or, put the other way, that the marmots would show shorter torpor bouts and longer arousal episodes than the ground squirrels do. The table shows data about torpor bouts and arousal episodes for the two species from 2008 to 2011. According to the table, the average duration of torpor bouts was 13.81 days for Alaska marmots, shorter than the average of 16.77 days for Arctic ground squirrels, and the average duration of arousal episodes was 21.2 hours for Alaska marmots, longer than the average of 14.2 hours for Arctic ground squirrels. Thus, the table supports the researcher’s hypothesis by showing that Alaska marmots had shorter bouts of torpor and longer arousal episodes than Arctic ground squirrels did.
Choice A is incorrect because it inaccurately describes data from the table and doesn’t support the researcher’s hypothesis. The table shows that the average duration of arousal episodes was less than a day for both Alaska marmots (21.2 hours) and Arctic ground squirrels (14.2 hours). Additionally, information about arousal episodes for Alaska marmots and Arctic ground squirrels isn’t sufficient to support a hypothesis involving comparisons of both arousal episodes and torpor bouts for those animals.
Choice B is incorrect because it doesn’t support the researcher’s hypothesis, which involves comparisons of arousal episodes as well as torpor bouts for Alaska marmots and Arctic ground squirrels. Noting that both animals had torpor bouts lasting several days, on average, doesn’t address arousal episodes at all, nor does it reveal how the animals’ torpor bouts compared.
Choice D is incorrect because it doesn’t support the researcher’s hypothesis. Although the table does show that Alaska marmots had more torpor bouts (12) than arousal episodes (11) and that their arousal episodes were much shorter than their torpor bouts (21.2 hours and 13.81 days, respectively), comparing data across only Alaska marmot behaviors isn’t sufficient to support a hypothesis about torpor and arousal behaviors of both Alaska marmots and Arctic ground squirrels.
Question 37
Employment by Sector in France and the United States, 1800–2012
(% of total employment)
| Year | Agriculture in France | Manufacturing in France | Services in France | Agriculture in US | Manufacturing in US | Services in US |
| 1800 | 64 | 22 | 14 | 68 | 18 | 13 |
| 1900 | 43 | 29 | 28 | 41 | 28 | 31 |
| 1950 | 32 | 33 | 35 | 14 | 33 | 53 |
| 2012 | 3 | 21 | 76 | 2 | 18 | 80 |
Over the past two hundred years, the percentage of the population employed in the agricultural sector has declined in both France and the United States, while employment in the service sector (which includes jobs in retail, consulting, real estate, etc.) has risen. However, this transition happened at very different rates in the two countries. This transition can be seen most clearly by comparing the employment by sector in both countries in ______
Which choice most effectively uses data from the table to complete the statement?
A) 1900 with the employment by sector in 1950.
B) 1800 with the employment by sector in 2012.
C) 1900 with the employment by sector in 2012.
D) 1800 with the employment by sector in 1900.
Choice A is the best answer because it presents data from the table that most effectively completes the statement about the rates at which employment shifted in France and the United States. The text states that over the last two hundred years, employment in the agricultural sector has declined while employment in the service sector has risen in both France and the US, and the data from the table reflect these trends. The text asserts, however, that the transition from agriculture to services “happened at very different rates in the two countries.” This assertion is best supported by a comparison of data from 1900 and 1950: the table shows that in those years, employment in agriculture went from 43% to 32% in France (a decline of 11 percentage points) and from 41% to 14% in the US (a decline of 27 percentage points), and that employment in services went from 28% to 35% in France (an increase of 7 percentage points) and from 31% to 53% in the US (an increase of 22 percentage points). In other words, the rate of change was greater in the US than in France for both sectors.
Choice B is incorrect because comparing the data for 1800 and 2012 would suggest a similar rate of change in the two countries, not very different rates: employment in agriculture went from 64% in 1800 to 3% in 2012 in France, which is close to the change from 68% in 1800 to 2% in 2012 in the US, while employment in services went from 14% in 1800 to 76% in 2012 in France, which is close to the change from 13% in 1800 to 80% in 2012 in the US.
Choice C is incorrect because comparing the data for 1900 and 2012 would suggest a similar rate of change in the two countries rather than very different rates: employment in agriculture went from 43% in 1900 to 3% in 2012 in France, which is close to the change from 41% in 1900 to 2% in 2012 in the US, while employment in services went from 28% in 1900 to 76% in 2012 in France, which is close to the change from 31% in 1900 to 80% in 2012 in the US.
Choice D is incorrect because comparing the data for 1800 and 1900 would suggest a similar rate of change in the two countries, not very different rates: employment in agriculture went from 64% in 1800 to 43% in 1900 in France, while employment in services went from 14% in 1800 to 28% in 1900 in France, while employment in services went from 14% in 1800 to 28% in 1900 in the US.
Question 38
A student is using the table as part of a social studies class presentation on the US auto industry in the early twentieth century. The student notes that, according to the table, from 1910 to 1925 _______
A) the number of cars produced increased but the number of companies producing cars decreased.
B) both the number of cars produced and the number of companies producing cars remained unchanged.
C) the number of cars produced decreased but the number of companies producing cars remained unchanged.
D) both the number of cars produced and the number of companies producing cars increased.
A) Correct – The table shows a steady increase in the number of cars produced (from 123,990 in 1910 to over 3 million in 1925), while the number of companies decreased (from 320 to 80). This choice accurately reflects the two opposite trends.
B) Incorrect – The table shows clear changes in both categories; neither remained unchanged.
C) Incorrect – The number of cars produced increased, not decreased; and companies did not remain unchanged—they decreased.
D) Incorrect – The number of companies decreased, not increased.
Question 39
To investigate potential cognitive benefits of taking leave from work, psychologist Jan Packer and colleagues conducted a six-month study.
Which choice best describes data from the graph that support the researchers’ conclusion?
A) In the second test administration, participants who took 2–4 days of leave had higher average attentiveness scores than did those who took no leave, but in the third test administration, those who took no leave had higher average scores than those who took 1–5 weeks of leave.
B) In the first test administration, participants who took 2–4 days of leave had lower average attentiveness scores than did those who took 1–5 weeks of leave and those who took no leave.
C) In both the second and third test administrations, participants who took 2–4 days of leave had higher average attentiveness scores than did participants who took 1–5 weeks of leave.
D) In the second and third test administrations, participants who took 2–4 days of leave had higher average attentiveness scores than did those who took no leave.
A) Incorrect – Compares 2–4 days of leave to no leave and 1–5 weeks of leave separately, which does not directly support the conclusion comparing short vs. long leave.
B) Incorrect – Refers to pre-leave data, which isn’t relevant to conclusions about leave benefits.
C) Correct – Directly supports the conclusion that longer leave doesn’t provide greater cognitive benefits than shorter leave.
D) Incorrect – Compares short leave to no leave, not short to long leave, which misses the focus of the researchers' conclusion.
Question 40
It may seem that the optimal strategy... as evidenced by the fact that _______
Which choice most effectively uses data from the graph to complete the text?
A) most lizard species use about the same percentage of their maximal speed when escaping predation as they do when pursuing prey.
B) multiple lizard species move at an average of less than 90% of their maximal speed while escaping predation.
C) more lizard species use, on average, 90%–100% of their maximal speed while escaping predation than use any other percentage of their maximal speed.
D) at least 4 lizard species use, on average, less than 100% of their maximal speed while pursuing prey.
A) Incorrect – The graph doesn't provide species-level data for that comparison.
B) Correct – Aligns with both the text's argument and the graph data showing many species using less than 90% speed when escaping.
C) Incorrect – Doesn’t support the idea that maximum speed is often avoided due to energy cost.
D) Incorrect – Focuses on pursuit, not escape, which the question is specifically about
Question 41
In 2021, four of the United States national parks that were among the most visited were Grand Canyon National Park, Rocky Mountain National Park, Yellowstone National Park, and Zion National Park. The graph shows the number of visits for recreation to each of these parks during the three-month period with the highest number of visitors. A student notes that among the parks shown in the graph, the park with the highest monthly recreation visits in all three months was _______
Which choice most effectively uses data from the graph to complete the text?
A) Zion National Park
B) Rocky Mountain National Park
C) Yellowstone National Park
D) Grand Canyon National Park
A) Incorrect – Zion had fewer visits in each month compared to Yellowstone.
B) Incorrect – Rocky Mountain had fewer visits in each month than Yellowstone.
C) Correct – Yellowstone had the highest recreation visits in June, July, and August of 2021.
D) Incorrect – Grand Canyon had consistently lower visit numbers than Yellowstone
Question 42
To test whether a medication is effective, scientists compare outcomes for patients taking it and patients taking a placebo (a medically inactive substance). Patients normally aren’t told they’re receiving a placebo, but a research team conducted a study to see if there might be a medical benefit to telling them. The team used various measures to evaluate participants, with higher ratings indicating greater well-being in each measure. Compared to the mean ratings after 21 days for participants in the control group, the mean ratings for participants who were aware of taking a placebo _______
Which choice most effectively uses data from the table to complete the statement?
A) ranged from 5.0 to 92.00, indicating that well-being varied widely from participant to participant.
B) were lower for two measures, with the rating for only one measure indicating greater well-being for these participants.
C) ranged from 3.9 to 46.00, with no rating indicating greater well-being in any measure for these participants.
D) were higher for all three measures, indicating greater overall well-being for these participants. "
Question 1
Global biomass is the total mass of living material, such as animals and plants, on Earth. A team of scientists estimated the global biomass, by species, of various wild land mammals. The team found that the species with the highest global biomass is the _______.
(A) wild boar
(B) eastern gray kangaroo
(C) African bush elephant
(D) white-tailed deer
Question 2
Studying tools unearthed at a cave site on the western coast of Italy, archaeologist Paola Villa and colleagues have determined that prehistoric Neanderthal groups fashioned them from shells of clams that they harvested from the seafloor while wading or diving or that washed up on the beach. Clamshells become thin and eroded as they wash up on the beach, while those on the seafloor are smooth and sturdy, so the research team suspects that Neanderthals prized the tools made with seafloor shells. However, the team also concluded that those tools were likely more challenging to obtain, noting that _______.
(A) at each depth below the surface in the cave, the difference in the numbers of tools of each type suggests that shells were easier to collect from the beach than to harvest from the seafloor.
(B) the highest number of tools were at a depth of 3–4 meters below the surface, which suggests that the Neanderthal population at the site was highest during the related period of time.
(C) at each depth below the surface in the cave, the difference in the numbers of tools of each type suggests that Neanderthals preferred to use clamshells from the beach because of their durability.
(D) the higher number of tools at depths of 5–6 meters below the surface in the cave than at depths of 4–5 meters below the surface suggests that the size of clam populations changed over time.
Question 3
Perovskite solar cells convert light into electricity more efficiently than earlier kinds of solar cells, and manufacturing advances have recently made them commercially attractive. One limitation of the cells, however, has to do with their electron transport layer (ETL), through which absorbed electrons must pass. Often the ETL is applied through a process called spin coating, but such ETLs are fairly inefficient at converting input power to output power. André Taylor and colleagues tested a novel spray coating method for applying the ETL. The team produced ETLs of various thicknesses and concluded that spray coating holds promise for improving the power conversion efficiency of ETLs in perovskite solar cells.
Which choice best describes data from the graph that support Taylor and colleagues’ conclusion?
(A) Both the ETL applied through spin coating and the ETL applied through spray coating showed a power conversion efficiency greater than 10% at their lowest performing thickness.
(B) The lowest performing ETL applied through spray coating had a higher power conversion efficiency than the highest performing ETL applied through spin coating.
(C) The highest performing ETL applied through spray coating showed a power conversion efficiency of approximately 13%, while the highest performing ETL applied through spin coating showed a power conversion efficiency of approximately 11%.
(D) There was a substantial difference in power conversion efficiency between the lowest and highest performing ETLs applied through spray coating.
Question 4
Over the past two hundred years, the percentage of the population employed in the agricultural sector has declined in both France and the United States, while employment in the service sector (which includes jobs in retail, consulting, real estate, etc.) has risen. However, this transition happened at very different rates in the two countries. This can be seen most clearly by comparing the employment by sector in both countries in _______.
(A) 1900 with the employment by sector in 1950.
(B) 1800 with the employment by sector in 2012.
(C) 1900 with the employment by sector in 2012.
(D) 1800 with the employment by sector in 1900.
Question 5
In a study of bottlenose dolphins, biologist Laela S. Sayigh and a team of researchers analyzed recordings of female bottlenose dolphins interacting with their calves.
According to the table, in which year was the dolphin with the ID FB43 recorded with her calf?
(A) 1999
(B) 2012
(C) 2020
(D) 1992
Question 6
For a school project, a forestry student needs to recommend a maple tree that is native to North America and won’t grow more than 60 feet in height. Based on the characteristics of five common maple trees, she has decided to select a _______
Which choice most effectively uses data from the table to complete the text?
(A) silver maple
(B) sugar maple
(C) red maple
(D) Norway maple
Question 7
Many plants lose their leaf color when exposed to kanamycin, an antibiotic produced by some soil microorganisms. Spelman College biologist Mentewab Ayalew and her colleagues hypothesized that plants’ response to kanamycin exposure involves altering their uptake of metals, such as iron and zinc. The researchers grew two groups of seedlings of the plant Arabidopsis thaliana, half of which were exposed to kanamycin and half of which were a control group without exposure to kanamycin, and measured the plants’ metal content five days after germination.
Which choice best describes data in the graph that supports Ayalew and her colleagues’ hypothesis?
(A) The control plants contained higher levels of zinc than iron, but plants exposed to kanamycin contained higher levels of iron than zinc.
(B) Both groups of plants contained more than 200 parts per million of both iron and zinc.
(C) Zinc levels were around 300 parts per million in the control plants but nearly 400 parts per million in the plants exposed to kanamycin.
(D) The plants exposed to kanamycin showed lower levels of iron and zinc than the control plants did.
Question 8
When hibernating, Alaska marmots and Arctic ground squirrels enter a state called torpor, which minimizes the energy their bodies need to function. Often, a hibernating animal will temporarily come out of torpor (called an arousal episode), causing a rise in metabolic rate and burning more energy. Alaska marmots hibernate in groups and therefore burn less energy during arousal episodes than they would if alone. A researcher hypothesized that because Arctic ground squirrels hibernate alone, they would likely exhibit longer bouts of torpor and shorter arousal episodes than Alaska marmots.
Which choice best describes data from the table that support the researcher’s hypothesis?
(A) The Alaska marmots’ arousal episodes lasted for days, while the Arctic ground squirrels’ arousal episodes lasted less than a day.
(B) The Alaska marmots and the Arctic ground squirrels both maintained torpor for several consecutive days per bout, on average.
(C) The Alaska marmots had shorter torpor bouts and longer arousal episodes than the Arctic ground squirrels did.
(D) The Alaska marmots had more torpor bouts than arousal episodes, but their arousal episodes were much shorter than their torpor bouts.
Question 9
A student studying beehive structure consults data on three species, concluding that _______
Which choice most effectively uses data from the graph to complete the student’s conclusion?
(A) Cells for worker eggs are probably closer in size to cells for drone eggs in the hives of the western honeybee than in the hives of the dwarf honeybee and the black dwarf honeybee.
(B) Both the western honeybee and the black dwarf honeybee probably reserve eight-sided cells for drone eggs, while the dwarf honeybee likely deposits drone eggs in seven-sided cells.
(C) The western honeybee probably relies on many more geometrical shapes when constructing cells than either the dwarf honeybee or the black dwarf honeybee does.
(D) The percentage of hexagonal cells is probably slightly lower in the hives of the western honeybee than in the hives of the dwarf honeybee and the black dwarf honeybee.
Question 10
In a recent study, researchers found that relatively few video games released over the decades remain available today. For example, only 14.22 percent of games are still available that were initially released in _______.
Which choice most effectively uses data from the table to complete the statement?
(A) 2000–2004
(B) 1995–1999
(C) 1970–1974
(D) 1985–1989
Question 11
Some oceanic fish species live very deep underwater. Researchers collected data about the depths at which various species live.
Based on the information in the table, at what depth does the southern stoplight loosejaw live?
(A) More than 2,000 meters below the surface
(B) 150 to 400 meters below the surface
(C) 500 to 2,000 meters below the surface
(D) 250 to 500 meters below the surface
Question 12
A group of researchers working in Europe, Asia, and Oceania conducted a study to determine how quickly different Eurasian languages are typically spoken (in syllables per second) and how much information they can effectively convey (in bits per second). They found that, although languages vary widely in the speed at which they are spoken, the amount of information languages can effectively convey tends to vary much less. Thus, they claim that two languages with very different spoken rates can nonetheless convey the same amount of information in a given amount of time.
Which choice best describes data from the table that supports the researchers’ claim?
(A) Among the five languages in the table, Thai and Hungarian have the lowest rates of speech and the lowest rates of information conveyed.
(B) Vietnamese conveys information at approximately the same rate as Spanish, despite being spoken at a slower rate.
(C) Among the five languages in the table, the language that is spoken the fastest is also the language that conveys information the fastest.
(D) Serbian and Spanish are spoken at approximately the same rate, but Serbian conveys information faster than Spanish does.
Question 13
The largest tyrannosaurids—the family of carnivorous dinosaurs that includes Tarbosaurus, Albertosaurus, and, most famously, Tyrannosaurus rex—are thought to have had the strongest bites of any land animals in Earth’s history. Determining the bite force of extinct animals can be difficult, however, and paleontologists Paul Barrett and Emily Rayfield have suggested that an estimate of dinosaur bite force may be significantly influenced by the methodology used in generating that estimate.
Which choice best describes data from the table that support Barrett and Rayfield’s suggestion?
A) The study by Meers used body-mass scaling and produced the lowest estimated maximum bite force, while the study by Cost et al. used muscular and skeletal modeling and produced the highest estimated maximum.
B) In their study, Gignac and Erickson used tooth-bone interaction analysis to produce an estimated bite force range with a minimum of 8,000 newtons and a maximum of 34,000 newtons.
C) The bite force estimates produced by Bates and Falkingham and by Cost et al. were similar to each other, while the estimates produced by Meers and by Gignac and Erickson each differed substantially from any other estimate.
D) The estimated maximum bite force produced by Cost et al. exceeded the estimated maximum produced by Bates and Falkingham, even though both groups of researchers used the same method to generate their estimates.
Question 14
Researcher Judith Hilton and her team interviewed 55 people about which factors would make them switch from using single-use plastic containers to reusable containers. The graph shows three of the factors mentioned in the interviews and the percentage of participants who mentioned them.
According to the graph, about what percentage of participants mentioned costs in the interviews?
(A) 10%
(B) 95%
(C) 25%
(D) 50%
Question 15
In a study of urban physical expansion, Richa Mahtta et al. conducted a meta-analysis of more than 300 cities worldwide to determine whether urban land expansion (ULE) was more strongly influenced by urban population growth or by growth in gross domestic product (GDP) per capita, a measure of economic activity. Because efficient national government is necessary to provide urban services and infrastructure that attract economic investment, Mahtta et al. propose that absent other factors, the importance of GDP per capita growth to ULE would likely increase relative to the importance of population growth as governments become more efficient. If true, this suggests the possibility that _______.
A) national governments of countries in Region 1 experienced declines in efficiency in the period from 2000 to 2014, relative to the period from 1970 to 2000.
B) countries in Region 1 experienced a slower rate of economic growth in the period from 2000 to 2014 than countries in Region 2 did, despite increasing national government efficiency in Region 1.
C) national governments of most countries in Region 2 became more efficient in the period from 2000 to 2014 than they had been in the period from 1970 to 2000, but those of several countries in this region did not.
D) national governments of countries in Region 1 and in Region 2 generally became more efficient in the period from 2000 to 2014 than they had been in the period from 1970 to 2000, but at different rates.
Question 16
A student is researching the Chinese government’s 1992 shift to a market economy that emphasizes trade liberalization. One means of trade liberalization involves expanding from ordinary imports into an emphasis on processing imports, which have two types: processing with assembly (in which a firm obtains raw materials from a foreign trading partner without payment and sells the final goods to that partner, charging for assembly) and processing with inputs (in which a firm expends capital to buy raw materials from a trading partner, processes them into final goods, and sells those goods to whichever trading partner it chooses). The student asserts that while initial efforts at trade liberalization were shaped by Chinese firms’ limited capital, this situation resolved during the 2000s.
Which choice best describes data from the graph that support the student’s assertion?
A) Processing imports with inputs were greater than both ordinary imports and processing imports with assembly in 2006.
B) From 2000 to 2006, processing imports with inputs rose much more sharply than processing imports with assembly did.
C) From 2000 to 2006, neither processing imports with inputs nor processing imports with assembly were greater than ordinary imports.
D) Processing imports with assembly were greater in 2006 than processing imports with inputs in 2000.
Question 17
A student is researching a bus system in a large county where surface temperatures vary by area and are hot in the summer. The student claims that all areas of the county should have more bus stops with shaded shelter, noting that the highest percentage of bus stops with shaded shelter for any area is only _______.
Which choice most effectively uses data from the table to complete the student’s claim?
A) 50%
B) 15%
C) 90%
D) 29%
Question 18
In terms of area and population, the three smallest Arabian Peninsula countries are Bahrain, Qatar, and Kuwait.
According to the table, what is the total area of Bahrain?
A) 4,268,873 square miles
B) 4,471 square miles
C) 304 square miles
D) 6,880 square miles
Question 19
Approximate Rates of Speech and Information Conveyed for Five Languages
| Language | Rate of speech (syllables per second) | Rate of information conveyed (bits per second) |
| Serbian | 7.2 | 39.1 |
| Spanish | 7.7 | 42.0 |
| Vietnamese | 5.3 | 42.5 |
| Thai | 4.7 | 33.8 |
| Hungarian | 5.9 | 34.6 |
A group of researchers working in Europe, Asia, and Oceania conducted a study to determine how quickly different Eurasian languages are typically spoken (in syllables per second) and how much information they can effectively convey (in bits per second). They found that, although languages vary widely in the speed at which they are spoken, the amount of information languages can effectively convey tends to vary much less. Thus, they claim that two languages with very different spoken rates can nonetheless convey the same amount of information in a given amount of time.
Which choice best describes data from the table that supports the researchers' claim?
A) Among the five languages in the table, Thai and Hungarian have the lowest rates of speech and the lowest rates of information conveyed.
B) Vietnamese conveys information at approximately the same rate as Spanish, despite being spoken at a slower rate.
C) Among the five languages in the table, the language that is spoken the fastest is also the language that conveys information the fastest.
D) Serbian and Spanish are spoken at approximately the same rate, but Serbian conveys information faster than Spanish does.
Question 20
To investigate the effect of lizard predation on spider populations, a student in a biology class placed spiders in two enclosures, one with lizards and one without, and tracked the number of spiders in the enclosures for 30 days. The student concluded that the reduction in the spider population count in the enclosure with lizards by day 30 was entirely attributable to the presence of the lizards.
Which choice best describes data from the graph that weakens the student’s conclusion?
A) The spider population count was the same in both enclosures on day 1.
B) The spider population count also substantially declined by day 30 in the enclosure without lizards.
C) The largest decline in spider population count in the enclosure with lizards occurred from day 1 to day 10.
D) The spider population count on day 30 was lower in the enclosure with lizards than in the enclosure without lizards.
Question 21
Estimates of Tyrannosaurid Bite Force
| Study | Year | Estimation method | Approximate bite force (newtons) |
| Cost et al. | 2019 | muscular and skeletal modeling | 35,000-63,000 |
| Gignac and Erickson | 2017 | tooth-bone interaction analysis | 8,000-34,000 |
| Meers | 2002 | body-mass scaling | 183,000-235,000 |
| Bates and Falkingham | 2012 | muscular and skeletal modeling | 35,000-57,000 |
The largest tyrannosaurs—the family of carnivorous dinosaurs that includes Tarbosaurus, Albertosaurus, and, most famously, Tyrannosaurus rex—are thought to have had the strongest bites of any land animals in Earth’s history. Determining the bite force of extinct animals can be difficult, however, and paleontologists Paul Barrett and Emily Rayfield have suggested that an estimate of dinosaur bite force may be significantly influenced by the methodology used in generating that estimate.
Which choice best describes data from the table that supports Barrett and Rayfield’s suggestion?
A) The study by Meers used body-mass scaling and produced the lowest estimated maximum bite force, while the study by Cost et al. used muscular and skeletal modeling and produced the highest estimated maximum.
B) In their study, Gignac and Erickson used tooth-bone interaction analysis to produce an estimated bite force range with a minimum of 8,000 newtons and a maximum of 34,000 newtons.
C) The bite force estimates produced by Bates and Falkingham and by Cost et al. were similar to each other, while the estimates produced by Meers and by Gignac and Erickson each differed substantially from any other estimate.
D) The estimated maximum bite force produced by Cost et al. exceeded the estimated maximum produced by Bates and Falkingham, even though both groups of researchers used the same method to generate their estimates.
Question 22
Maximum Height of Maple Trees When Fully Grown
| Tree type | Maximum height (feet) | Native to North America |
| Sugar maple | 75 | yes |
| Silver maple | 70 | yes |
| Red maple | 60 | yes |
| Japanese maple | 25 | no |
| Norway maple | 50 | no |
For a school project, a forestry student needs to recommend a maple tree that is native to North America and won’t grow more than 60 feet in height. Based on the characteristics of five common maple trees, she has decided to select a ______.
Which choice most effectively uses data from the table to complete the text?
A) Silver maple
B) Sugar maple
C) Red maple
D) Norway maple
Question 23
Characteristics of Five Recently Discovered Gas Exoplanets
| Exoplanet designation | Mass (Jupiters) | Radius (Jupiters) | Orbital period (days) | Distance from the Sun (parsecs) |
| TOI-640 b | 0.88 | 1.771 | 5.003 | 340 |
| TOI-1601 b | 0.99 | 1.239 | 5.331 | 336 |
| TOI-628 b | 6.33 | 1.060 | 3.409 | 178 |
| TOI-1478 b | 0.85 | 1.060 | 10.180 | 153 |
| TOI-1333 b | 2.37 | 1.396 | 4.720 | 200 |
“Hot Jupiters” are gas planets that have a mass of at least 0.25 Jupiters (meaning that their mass is at least 25% of that of Jupiter) and an orbital period of less than 10 days (meaning that they complete one orbit around their star in less than 10 days), while “warm Jupiters” are gas planets that meet the same mass criterion but have orbital periods of more than 10 days. In 2021, Michigan State University astronomer Joseph Rodriguez and colleagues announced the discovery of five new gas exoplanets and asserted that four are hot Jupiters and one is a warm Jupiter.
Which choice best describes data from the table that support Rodriguez and colleagues' assertion?
A) None of the planets have an orbital period of more than 10 days, and TOI-628 b has a mass of 6.33 Jupiters.
B) TOI-1478 b has an orbital period of 153 days, and the masses of all the planets range from 0.85 to 6.33 Jupiters.
C) All the planets have a radius between 1.060 and 1.771 Jupiters, and TOI-1333 b has an orbital period of more than 10 days.
D) Each of the planets has a mass greater than 0.25 Jupiters, and all except for TOI-1478 have an orbital period of less than 10 days.
Question 24
Economists Kerwin Kofi Charles and Melvin Stephens Jr. investigated a variety of factors that influence voter turnout in the United States. Using survey data that revealed whether respondents voted in national elections and how knowledgeable respondents are about politics, Charles and Stephens claim that the likelihood of voting is driven in part by potential voters' confidence in their assessments of candidates—essentially, the more informed voters are about politics, the more confident they are at evaluating whether candidates share their views, and thus the more likely they are to vote.
Which choice best describes data in the graph that supports Charles and Stephens’s claim?
A) At each point on the political orientation scale, high-information voters were more likely than low-information voters to vote.
B) Only low-information voters who identify as independents had a voting probability below 50%.
C) The closer that low-information voters are to the ends of the political orientation scale, the more likely they were to vote.
D) High-information voters were more likely to identify as strong Democrats or strong Republicans than low-information voters were.
Question 25
Organic farming is a method of growing food that tries to reduce environmental harm by using natural forms of pest control and avoiding fertilizers made with synthetic materials. Organic farms are still a small fraction of the total farms in the United States, but they have been becoming more popular. According to the US Department of Agriculture, in 2016, California had between 2,600 and 2,800 organic farms and _________.
Which choice most effectively uses data from the graph to complete the text?
A) Washington had between 600 and 800 organic farms.
B) New York had fewer than 800 organic farms.
C) Wisconsin and Iowa each had between 1,200 and 1,400 organic farms.
D) Pennsylvania had more than 1,200 organic farms.
Question 26
Ablation Rates for Three Elements in Cosmic Dust, by Dust Source
| Element | SPC | AST | HTC | OCC |
| iron | 20% | 28% | 90% | 98% |
| potassium | 44% | 74% | 97% | 100% |
| sodium | 45% | 75% | 99% | 100% |
Earth’s atmosphere is bombarded by cosmic dust originating from several sources: short-period comets (SPCs), particles from the asteroid belt (ASTs), Halley-type comets (HTCs), and Oort cloud comets (OCCs). Some of the dust’s material vaporizes in the atmosphere in a process called ablation, and the faster the particles move, the higher the rate of ablation. Astrophysicist Juan Diego Carrillo-Sánchez led a team that calculated average ablation rates for elements in the dust (such as iron and potassium) and showed that material in slower-moving SPC or AST dust has a lower rate than the same material in faster-moving HTC or OCC dust. For example, whereas the average ablation rate for iron from AST dust is 28%, the average rate for __________.
Which choice most effectively uses data from the table to complete the example?
A) iron from SPC dust is 20%.
B) sodium from OCC dust is 100%.
C) iron from HTC dust is 90%.
D) sodium from AST dust is 75%.
Question 27
Effects of Mycorrhizal on 3 Plant Species
| Plant species | Mycorrhizal host | Average mass of plants grown in soil containing mycorrhizal fungi (in grams) | Average mass of plants grown in soil treated to kill fungi (in grams) |
| Corn | yes | 15.1 | 3.8 |
| Marigold | yes | 10.2 | 2.4 |
| Broccoli | no | 7.5 | 7 |
Mycorrhizal fungi in soil benefits many plants, substantially increasing the mass of some. A student conducted an experiment to illustrate this effect. The student chose three plant species for the experiment, including two that are mycorrhizal hosts (species known to benefit from mycorrhizal fungi) and one nonmycorrhizal species (a species that doesn’t benefit from and may even be harmed by mycorrhizal fungi). The student then grew several plants from each species both in soil containing mycorrhizal fungi and in soil that had been treated to kill mycorrhizal and other fungi. After several weeks, the student measured the plants’ average mass and was surprised to discover ________.
Which choice most effectively uses data from the table to complete the statement?
A) Broccoli grown in soil containing mycorrhizal fungi had a slightly higher average mass than broccoli grown in soil that had been treated to kill fungi.
B) Corn grown in soil containing mycorrhizal fungi had a higher average mass than broccoli grown in soil containing mycorrhizal fungi.
C) Marigolds grown in soil containing mycorrhizal fungi had a much higher average mass than marigolds grown in soil that had been treated to kill fungi.
D) Corn had the highest average mass of all three species grown in soil that had been treated to kill fungi, while marigolds had the lowest.
Question 28
High levels of public uncertainty about which economic policies a country will adopt can make planning difficult for businesses, but measures of such uncertainty have not tended to be very detailed. Recently, however, economist Sandile Hlatshwayo analyzed trends in news reports to derive measures not only for general economic policy uncertainty but also for uncertainty related to specific areas of economic policy, like tax or trade policy. One revelation of her work is that a general measure may not fully reflect uncertainty about specific areas of policy, as in the case of the United Kingdom, where general economic policy uncertainty ________.
Which choice most effectively uses data from the graph to illustrate the claim?
A) aligned closely with uncertainty about tax and public spending policy in 2005 but differed from uncertainty about tax and public spending policy by a large amount in 2009.
B) was substantially lower than uncertainty about tax and public spending policy each year from 2005 to 2010.
C) reached its highest level between 2005 and 2010 in the same year that uncertainty about trade policy and tax and public spending policy reached their lowest levels.
D) was substantially lower than uncertainty about trade policy in 2005 and substantially higher than uncertainty about trade policy in 2010.
Question 29
Partial List of Candidate Species for De-extinction
| Common name | Scientific name | Became extinct |
| Huia | Heteralocha acutirostris | 1907 |
| Caribbean monk seal | Monachus tropicalis | 1952 |
| Passenger pigeon | Ectopistes migratorius | 1914 |
| Saber-toothed cat | Smilodon | 11,000 years before present |
| Woolly mammoth | Mammuthus primigenius | 6,400 years before present |
The passage of time is among the many obstacles faced by scientists who are pursuing de-extinction efforts—that is, efforts to use breeding or a mixture of cloning and genetic engineering to bring back extinct species. Specifically, researchers are concerned that the longer a species has been extinct, the less likely it is that a suitable habitat still exists for that species. Among candidate species for de-extinction, this problem would be especially concerning for the ______.
Which choice most effectively uses data from the table to complete the statement?
A) passenger pigeon (Ectopistes migratorius), which became extinct only a few years after the huia (Heteralocha acutirostris).
B) saber-toothed cat (Smilodon), which became extinct 11,000 years ago.
C) woolly mammoth (Mammuthus primigenius), which became extinct several thousand years before the saber-toothed cat (Smilodon).
D) Caribbean monk seal (Monachus tropicalis), which became extinct in 1952.
Question 30
The population of the coral Lophelia pertusa declined significantly around 9,000 years ago in the Alboran Sea and around 11,000 years ago near the Mauritanian coast. Using the ratio of manganese to calcium, which inversely correlates with ocean oxygenation levels, marine scientist Rodrigo da Costa Portilho-Ramos and colleagues evaluated whether oxygenation played a role in the declines of L. pertusa. The researchers concluded that oxygenation may have been important in the Alboran Sea but not near the Mauritanian coast, since ________.
Which choice most effectively uses data from the graph to complete the statement?
A) a substantial increase in oxygenation in the Alboran Sea corresponded with the local decline in L. pertusa, but the opposite relationship between oxygenation and L. pertusa was found near the Mauritanian coast.
B) L. pertusa declined in the Alboran Sea during a period of substantial local decline in oxygenation, but L. pertusa declined near the Mauritanian coast during a period of little local change in oxygenation.
C) oxygenation in the Alboran Sea was higher before the decline in L. pertusa than after the decline, whereas oxygenation near the Mauritanian coast was relatively low both before and after the decline in L. pertusa.
D) oxygenation in the Alboran Sea tended to be substantially higher than oxygenation near the Mauritanian coast during the period studied.
Question 31
A student is researching the trends in the topics submitted to a national science fair for high school students. The graph shows the number of submissions by topic that were made each year. Based on the data in the graph, the student claims that there were more medicine and health research topics submitted in 2019 than in any other year.
Which choice most effectively uses data from the graph to support the underlined claim?
A) In 2016, the number of cellular and molecular biology topic submissions was the same as the number of animal science topic submissions.
B) In 2019, there were more physics and space science topic submissions than there were medicine and health topic submissions.
C) The lowest number of animal science topic submissions during the period shown was approximately 95 in 2016.
D) The highest number of medicine and health topic submissions during the period shown is approximately 285 in 2019.
Question 32
Inés Ibáñez and colleagues studied a forest site in which some sugar maple trees receive periodic fertilization with nitrogen to mimic the broader trend of increasing anthropogenic nitrogen deposition in soil. Ibáñez and colleagues modeled the radial growth of the trees with and without nitrogen fertilization under three different climate scenarios (the current climate, moderate change, and extreme change). Although they found that climate change would negatively affect growth, they concluded that anthropogenic nitrogen deposition could more than offset that effect, provided that the change is moderate rather than extreme.
Which choice best describes data from the graph that supports Ibáñez and colleagues’ conclusion?
A) Growth with nitrogen under the current climate exceeded growth with nitrogen under moderate change, but the latter exceeded growth without nitrogen under extreme change.
B) Growth without nitrogen under the current climate exceeded growth with nitrogen under moderate change, but the latter exceeded growth without nitrogen under extreme change.
C) Growth with nitrogen under moderate change exceeded growth without nitrogen under moderate change, but the latter exceeded growth without nitrogen under extreme change.
D) Growth with nitrogen under moderate change exceeded growth without nitrogen under the current climate, but the latter exceeded growth with nitrogen under extreme change.
Question 33
Simulated Change in Annual Aquifer Input and Irrigation Output if
Precipitation Concentration Increases as Climate Models Predict
| Baseline concentration of annual precipitation | % change in water entering aquifers | % change in surface water used for irrigation | % change in groundwater used for irrigation |
| Precipitation is currently somewhat concentrated | 4.9 | 0.4 | 0.9 |
| Precipitation is currently evenly distributed | 11.0 | 9.0 | 7.9 |
Some climate models for the western United States predict that while total annual precipitation may remain unchanged from the present level, precipitation will become concentrated into fewer but more intense rain and snow events. University of Texas climate scientist Geeta Persad and her colleagues simulated how the amount of water entering aquifers and the amount being used for irrigation purposes would change if this were to occur. Persad and her colleagues concluded that the concentration of precipitation into fewer events would result in a higher number of dry days, triggering more irrigation, but that this change in irrigation output is highly sensitive to the baseline concentration of precipitation that currently exists in an area.
Which choice best describes data from the table that supports Persad and her colleagues’ conclusion?
A) If baseline precipitation is somewhat concentrated, the amount of water being used for irrigation will increase 0.4% for surface water and 0.9% for groundwater, whereas the amount of water entering aquifers will increase 11.0% if baseline precipitation is evenly distributed.
B) If baseline precipitation is somewhat concentrated, water use for irrigation will increase only slightly, whereas it will increase 9.0% for surface water and 7.9% for groundwater if baseline precipitation is evenly distributed.
C) If baseline precipitation is somewhat concentrated, the amount of water entering aquifers will increase 4.9%, while the amount being used for irrigation will increase 0.4% for surface water and 0.9% for groundwater.
D) If baseline precipitation is somewhat concentrated, water use for irrigation will decline by a small amount, whereas it will increase 11.0% for surface water and 9.0% for groundwater if baseline precipitation is evenly distributed.
Question 34
Ablation Rates for Three Elements in Cosmic Dust, by Dust Source
| Element | SPC | AST | HTC | OCC |
| iron | 20% | 28% | 90% | 98% |
| potassium | 44% | 74% | 97% | 100% |
| sodium | 45% | 75% | 99% | 100% |
Earth's atmosphere is bombarded by cosmic dust originating from several sources: short-period comets (SPCs), particles from the asteroid belt (ASTs), Halley-type comets (HTCs), and Oort cloud comets (OCCs). Some of the dust's material vaporizes in the atmosphere in a process called ablation, and the faster the particles move, the higher the rate of ablation. Astrophysicist Juan Diego Carrillo-Sánchez led a team that calculated average ablation rates for elements in the dust (such as iron and potassium) and showed that material in slower-moving SPC or AST dust has a lower rate than the same material in faster-moving HTC or OCC dust. For example, whereas the average ablation rate for iron from AST dust is 28%, the average rate for __________.
Which choice most effectively uses data from the table to complete the example?
A) iron from SPC dust is 20%
B) sodium from OCC dust is 100%
C) iron from HTC dust is 90%
D) sodium from AST dust is 75%
Question 35
High levels of public uncertainty about which economic policies a country will adopt can make planning difficult for businesses, but measures of such uncertainty have not tended to be very detailed. Recently, however, economist Sandile Hlatshwayo analyzed trends in news reports to derive measures not only for general economic policy uncertainty but also for uncertainty related to specific areas of economic policy, like tax or trade policy. One revelation of her work is that a general measure may not fully reflect uncertainty about specific areas of policy, as in the case of the United Kingdom, where general economic policy uncertainty.
Which choice most effectively uses data from the graph to illustrate the claim?
A) aligned closely with uncertainty about tax and public spending policy in 2005 but differed from uncertainty about tax and public spending policy by a large amount in 2009.
B) was substantially lower than uncertainty about tax and public spending policy from 2005 to 2010.
C) reached its highest level between 2005 and 2010 in the same year that uncertainty about trade policy and tax and public spending policy reached their lowest levels.
D) was substantially lower than uncertainty about trade policy in 2005, but reached similar levels in 2009.
Question 36
Average Number and Duration of Torpor Bouts and Arousal Episodes for Alaska Marmots
and Arctic Ground Squirrels, 2008-2011
| Feature | Alaska marmots | Arctic ground squirrels |
| torpor bouts | 12 | 10.5 |
| duration per bout | 13.81 days | 16.77 days |
| arousal episodes | 11 | 9.5 |
| duration per episode | 21.2 hours | 14.2 hours |
When hibernating, Alaska marmots and Arctic ground squirrels enter a state called torpor, which minimizes the energy their bodies need to function. Often, a hibernating animal will temporarily come out of torpor (called an arousal episode) and its metabolic rate will rise, burning more of the precious energy the animal needs to survive the winter. Alaska marmots hibernate in groups and therefore burn less energy keeping warm during these episodes than they would if they were alone. A researcher hypothesized that because Arctic ground squirrels hibernate alone, they would likely exhibit longer bouts of torpor and shorter arousal episodes than Alaska marmots.
Which choice best describes data from the table that supports the researcher’s hypothesis?
A) The Alaska marmots’ arousal episodes lasted for days, while the Arctic ground squirrels’ arousal episodes lasted less than a day.
B) The Alaska marmots and the Arctic ground squirrels both maintained torpor for several consecutive days per bout, on average.
C) The Alaska marmots had shorter torpor bouts and longer arousal episodes than the Arctic ground squirrels did.
D) The Alaska marmots had more torpor bouts than arousal episodes, but their arousal episodes were much shorter than their torpor bouts.
Question 37
Employment by Sector in France and the United States, 1800–2012
(% of total employment)
| Year | Agriculture in France | Manufacturing in France | Services in France | Agriculture in US | Manufacturing in US | Services in US |
| 1800 | 64 | 22 | 14 | 68 | 18 | 13 |
| 1900 | 43 | 29 | 28 | 41 | 28 | 31 |
| 1950 | 32 | 33 | 35 | 14 | 33 | 53 |
| 2012 | 3 | 21 | 76 | 2 | 18 | 80 |
Over the past two hundred years, the percentage of the population employed in the agricultural sector has declined in both France and the United States, while employment in the service sector (which includes jobs in retail, consulting, real estate, etc.) has risen. However, this transition happened at very different rates in the two countries. This transition can be seen most clearly by comparing the employment by sector in both countries in ______
Which choice most effectively uses data from the table to complete the statement?
A) 1900 with the employment by sector in 1950.
B) 1800 with the employment by sector in 2012.
C) 1900 with the employment by sector in 2012.
D) 1800 with the employment by sector in 1900.
Question 38
A student is using the table as part of a social studies class presentation on the US auto industry in the early twentieth century. The student notes that, according to the table, from 1910 to 1925 _______
A) the number of cars produced increased but the number of companies producing cars decreased.
B) both the number of cars produced and the number of companies producing cars remained unchanged.
C) the number of cars produced decreased but the number of companies producing cars remained unchanged.
D) both the number of cars produced and the number of companies producing cars increased.
Question 39
To investigate potential cognitive benefits of taking leave from work, psychologist Jan Packer and colleagues conducted a six-month study.
Which choice best describes data from the graph that support the researchers’ conclusion?
A) In the second test administration, participants who took 2–4 days of leave had higher average attentiveness scores than did those who took no leave, but in the third test administration, those who took no leave had higher average scores than those who took 1–5 weeks of leave.
B) In the first test administration, participants who took 2–4 days of leave had lower average attentiveness scores than did those who took 1–5 weeks of leave and those who took no leave.
C) In both the second and third test administrations, participants who took 2–4 days of leave had higher average attentiveness scores than did participants who took 1–5 weeks of leave.
D) In the second and third test administrations, participants who took 2–4 days of leave had higher average attentiveness scores than did those who took no leave.
Question 40
It may seem that the optimal strategy... as evidenced by the fact that _______
Which choice most effectively uses data from the graph to complete the text?
A) most lizard species use about the same percentage of their maximal speed when escaping predation as they do when pursuing prey.
B) multiple lizard species move at an average of less than 90% of their maximal speed while escaping predation.
C) more lizard species use, on average, 90%–100% of their maximal speed while escaping predation than use any other percentage of their maximal speed.
D) at least 4 lizard species use, on average, less than 100% of their maximal speed while pursuing prey.
Question 41
In 2021, four of the United States national parks that were among the most visited were Grand Canyon National Park, Rocky Mountain National Park, Yellowstone National Park, and Zion National Park. The graph shows the number of visits for recreation to each of these parks during the three-month period with the highest number of visitors. A student notes that among the parks shown in the graph, the park with the highest monthly recreation visits in all three months was _______
Which choice most effectively uses data from the graph to complete the text?
A) Zion National Park
B) Rocky Mountain National Park
C) Yellowstone National Park
D) Grand Canyon National Park
Question 42
To test whether a medication is effective, scientists compare outcomes for patients taking it and patients taking a placebo (a medically inactive substance). Patients normally aren’t told they’re receiving a placebo, but a research team conducted a study to see if there might be a medical benefit to telling them. The team used various measures to evaluate participants, with higher ratings indicating greater well-being in each measure. Compared to the mean ratings after 21 days for participants in the control group, the mean ratings for participants who were aware of taking a placebo _______
Which choice most effectively uses data from the table to complete the statement?
A) ranged from 5.0 to 92.00, indicating that well-being varied widely from participant to participant.
B) were lower for two measures, with the rating for only one measure indicating greater well-being for these participants.
C) ranged from 3.9 to 46.00, with no rating indicating greater well-being in any measure for these participants.
D) were higher for all three measures, indicating greater overall well-being for these participants. "


